Download
1 / 28
280 likes | 427 Views
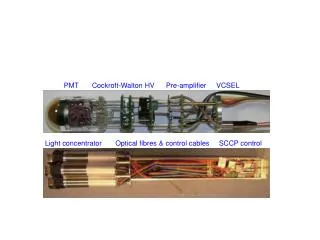
HF PMT ISSUES. By Ugur Akgun The University of Iowa. Outline. Introduction to HF PMTs. PMT Selection Process Complete Tests on 2000 PMTs Relative Gain, Gain vs HV Afterpulse Rate Issue What is PMT Afterpulse and its rate? The University of Iowa Afterpulse Tests

E N D
HF PMT ISSUES By Ugur Akgun The University of Iowa U. Akgun, HCAL Fall Meeting, 11/11/2004, Fermilab, IL
Outline • Introduction to HF PMTs. • PMT Selection Process • Complete Tests on 2000 PMTs • Relative Gain, Gain vs HV • Afterpulse Rate Issue • What is PMT Afterpulse and its rate? • The University of Iowa Afterpulse Tests • Hamamatsu Afterpulse Tests • TB2004 Analysis for PMT Afterpulses • Conclusion U. Akgun, HCAL Fall Meeting, 11/11/2004, Fermilab, IL
HF PMT Specs Window Material Borosilicate glass Eff. Pho.cath. dia. 22-28mm, head-on Quantum efficiency>15% 400-500 nm Photocathode lifetime >200 mC Anode current vs position<+/-20% with 3 mm spot scan Gain 104 to 105, at <0.75 x V(max) Single pe resolutionrms/mean if single pe peak 50% or better Pulse linearity +/- 2% for 1-3000 photoelectrons (g=4X10^4) Anode pulse rise-time<5ns Transit time<25 ns preferred Transit time spread<2 ns preferred Anode pulse width<15 ns FWHM Gain (1/2)-lifetime>1500 C Gain recov. (2000pe pulse) within 10% of nominal (g=10^4) in 25 ns Average current Ik <1 nA (g=10^4) Average current Ia <10 microA (g=10^4) Anode dark current<2 nA (g=10^4) Stability <+/- 3% within any 48 hr. period Envelope opaque and -HV conductive coating U. Akgun, HCAL Fall Meeting, 11/11/2004, Fermilab, IL
Candidate PMTs and Tests • Photonis • XP3182/D1 • XP2960 • Electron Tubes • D843WSB • D844WSB • Hamamatsu • R7525 Testing, Evaluation and Results Reported at CMS-IN 2002-026, CMS-IN 2002-030, CMS-IN 2002-032, CMS-NOTE 2003/029, IEEE Transactions on Nuclear Science. Vol. 51, No. 4, August, 2004 U. Akgun, HCAL Fall Meeting, 11/11/2004, Fermilab, IL
Testing 2000 Hamamatsu R7525 • Iowa Measurements: • Timing (Pulse Width, Rise Time, Transit Time, TTS) • Linearity, Relative Gain, Dark Current, Single Photoelectron Resolution • Hamamatsu Measurements: • Cathode Luminous Sensitivity, Anode Luminous Sensitivity, Anode Dark Current @1500V, Cathode Blue Sensitivity • Anode Dark Current and Anode Voltage (@ Gain 5xe4) • Database is on the web. • All info sent along with the PMTs and sorting tables. • “Complete tests of 2000 Hamamatsu R7525HA Phototubes for the CMS-HF Forward Calorimeter” CMS-NOTE 2004/019, Submitted to IEEE Transactions on Nuclear Science U. Akgun, HCAL Fall Meeting, 11/11/2004, Fermilab, IL
Relative Gain Reference PMT, HV vs Gain measurements 900V-1650V (30 measurements) Max 4% variation. Relative Gain vs HV (E. Gulmez, CMS Note Draft) U. Akgun, HCAL Fall Meeting, 11/11/2004, Fermilab, IL
For 2000 PMTs Iowa Measurements Hamamatsu Measurements U. Akgun, HCAL Fall Meeting, 11/11/2004, Fermilab, IL
TB2004 Data EM PMTs, Variation is 9%-10% after RG Corrections Corrected and Normalized Output Normalized Output & RG values Andrei Gribushin's SPE data for W-6 HAD PMTs, Variation is 11%-13% after RG Corrections Corrected and Normalized Output Normalized Output & RG values U. Akgun, HCAL Fall Meeting, 11/11/2004, Fermilab, IL
TB2004 Data W-13, 100 GeV electron data, with 1150V and 1350V • The variation is 13% on both • HV values. (~4% more than spe) • Due to optical differences?? • -Qie channels • Light guide coupling • Fiber lengths • Leakage • HV variations • Connectors • Table position uncertainity • Beam variation • … U. Akgun, HCAL Fall Meeting, 11/11/2004, Fermilab, IL
PMT Afterpulse 101 • Definition: Afterpulses are spurious pulses that appear in the wake of true pulses. • FACT: Every true pulse may be followed by one or more afterpulses. • FACT: The afterpulse size(charge) does not vary with respect to the incoming pulse height. • FACT: For bigger incoming light more afterpulses appear, So total charge ratio stays the same. • i.e.; Finding the amplitude ratio of afterpulse to any main pulse, at any given light intensity, is NOT RATE.. because IT IS DIFFERENT for every incoming light intensity. • i.e.; Finding the number of afterpulses for any main pulse, at any given light intensity, is NOT RATE... Because IT IS DIFFERENT for every light intensity, as well. • Only meaningful AFTERPULSE RATE definition is: RATE = (ΣQafterpulse /ΣQmain pulse ) x 100 U. Akgun, HCAL Fall Meeting, 11/11/2004, Fermilab, IL
The References • “As long as the gain is not too high, the ratio does vary much with the number of true pulses, or the amount of charge they contain. When the charge transferred by each true pulse is very small (i.e. SPE level), that transferred by each afterpulse may be as large or even larger. However, as proportionally fewer true pulses are then followed by afterpulses, the charge ratio remains the same.”(Phillips, Photomultiplier Tubes Principles and Applications, page 4-42). Definitions and effects: • Hamamatsu and Philips PMT books. • B.H. Candy: Rev. Sci. Instr. 56, 183 (1985) • G.A. Morton et al.: IEEE Tran. Nucl. Sci. NS-14 No.1, 443, (1967) ** • R. Staubert et al., NIM 84, 297 (1970) • S.S. Stevens et al., IEEE Tran. Nucl. Sci. NS-19 No.1, 356, (1972) Suppression ideas: • S.J. Hall et al., NIM 112, 545 (1973) • G.P. Lamaze et al., NIM 123, 403 (1975) U. Akgun, HCAL Fall Meeting, 11/11/2004, Fermilab, IL
The University of Iowa Afterpulse Tests • The tests are performed on 3 different PMT Types: (R7525, R6427, R1398). • We Tested 83 R7525 (HF PMTs). • Blue LED (with 420 nm peak) is used as light source. The light intensity set to be 2TeV. • The LED driver is running with 100 kHz, providing the gate signal as well. • The gate signal is generated by LeCroy 222 Dual Gate Generator. • The measurements are taken by LeCroy 2249 ADC. • Every measurement contains 10,000 ADC counts. • We DID NOT use any amplifier to eliminate the noise factor. U. Akgun, HCAL Fall Meeting, 11/11/2004, Fermilab, IL
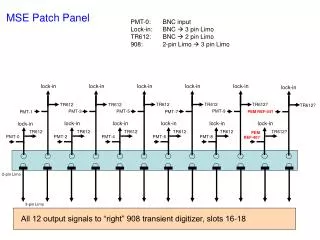
Iowa Afterpulse Test Setup U. Akgun, HCAL Fall Meeting, 11/11/2004, Fermilab, IL
Iowa Measurements R7525 • Every PMT we tested shows afterpulses. • There is no magic PMT that gives no afterpulses. R6427 R1398 U. Akgun, HCAL Fall Meeting, 11/11/2004, Fermilab, IL
Iowa Afterpulse Timings R7525 Different PMTs, similar afterpulse delay times. 2000 events each. With high voltage change peak positions shift. ~300ns ~400ns R6427 ~300ns ~300ns R1398 U. Akgun, HCAL Fall Meeting, 11/11/2004, Fermilab, IL
R7525 Afterpulse Delay Time R7525 Afterpulses appear to have 3 distinct delay time regions, possibly due to H2+, He+ and CH4+ U. Akgun, HCAL Fall Meeting, 11/11/2004, Fermilab, IL
Iowa Afterpulse Rate Results All afterpulses in 150ns-2μsec range Different HV values Different light intensity • Result: R7525 total afterpulse rate (around 2μsec range) is always ~3%. • It is constant with different light • Intensities, but tends to increase to ~5% at 1750V. U. Akgun, HCAL Fall Meeting, 11/11/2004, Fermilab, IL
Rates of Afterpulse Peak Regions Hamamatsu R7525 Only Rate from peak regions Single Photoelectron level; No charge accumulation observed over pedestal level, from afterpulse regions 10000 ADC counts U. Akgun, HCAL Fall Meeting, 11/11/2004, Fermilab, IL
Iowa Afterpulse Conclusion • There are afterpulses for R7525 as every other PMT. • The afterpulses appear to localize at 3 distinct time delay regions. • Afterpulse rate is ~3%, for 150ns-2μsec region. • The charge accumulation rate due to the afterpulse regions mostly less than 1%. • It is less than Dark Current charge ratio. • It does not vary with respect to the batch number. • It does not vary with respect to the incoming light intensity or frequency. • It does not vary much with PMT high voltages. U. Akgun, HCAL Fall Meeting, 11/11/2004, Fermilab, IL
Hamamatsu Tests Charge Mode • Hamamatsu performed afterpulse tests on R7525 PMTs in Charge Mode and Counting Mode. • They used ~400 GeV light for charge mode, ~80 GeV for counting mode. Counting Mode U. Akgun, HCAL Fall Meeting, 11/11/2004, Fermilab, IL
Hamamatsu Charge Mode Setup Charge coming from the afterpulses are integrated on a 9500 ns range!! U. Akgun, HCAL Fall Meeting, 11/11/2004, Fermilab, IL
Hamamatsu Counting Mode Setup Number of afterpulses coming 150ns after the main pulse are counted U. Akgun, HCAL Fall Meeting, 11/11/2004, Fermilab, IL
Hamamatsu Results Counting Mode and Charge Mode give Around 3-5% over 9500ns range. Different light intensities. Different PMT gains. U. Akgun, HCAL Fall Meeting, 11/11/2004, Fermilab, IL
Hamamatsu Conclusion • R7525 Afterpulses are not different than any other PMT Hamamatsu produces. • The afterpulse tests done in 2001 give the same result with 2004 tests. So there is no change in time. • Afterpulse rate does not change with PMT gain (HV) or incoming light intensity. • In the charge mode the integrated afterpulses on 9500ns range produce ~2-3% rate. U. Akgun, HCAL Fall Meeting, 11/11/2004, Fermilab, IL
TB2004 PMT Afterpulse Analysis 60 Time Slice Data for Wedge 13, at 1150V and 1350V 60 Time Slice data The 3 peaks can easily be seen. 20 Time Slice Data, afterpulses. U. Akgun, HCAL Fall Meeting, 11/11/2004, Fermilab, IL
Integrated PMT Afterpulse Rate • When we take 1.1μsec afterpulse region: • - 1150V gives 2-4% afterpulse rate • - 1350V gives 2-6% afterpulse rate • On both cases, Tower 20 is • significantly higher than the others Fit to the summation of these two graphs gives 3.2% afterpulse rate. U. Akgun, HCAL Fall Meeting, 11/11/2004, Fermilab, IL
W-13 Afterpulse Rate for 25ns We calculated the charge accumulation rate of every 25ns bin of every tower with respect to the biggest 25ns signal bin. In any given 25ns time, afterpulse charge accumulation rate is rarely More than that of Dark Current. U. Akgun, HCAL Fall Meeting, 11/11/2004, Fermilab, IL
Summary on HF PMTs • PMT selection and testing is well documented. And Iowa-Hamamatsu measurements are in database, on the web. • The relative gain values (taken at 1100V) tend to have bigger variation as we increase the HV. • PMT afterpulse charge accumulation rate is around that of PMT dark current. U. Akgun, HCAL Fall Meeting, 11/11/2004, Fermilab, IL