Download

1 / 41
420 likes | 724 Views
Break Even Analysis. Presented by Francis Pinto 17 Shilpa Kulkarni 31 Pradnya Morje 36 Amol Rane 43 Tushar Wadivkar 57 Aditya Divadkar 58. Costs are of two types. Total cost = Variable cost + Fixed cost Variable cost Fixed cost Direct Common / indirect

E N D
Break Even Analysis Presented by Francis Pinto 17 Shilpa Kulkarni 31 Pradnya Morje 36 Amol Rane 43 Tushar Wadivkar 57 Aditya Divadkar 58
Costs are of two types Total cost = Variable cost + Fixed cost Variable cost Fixed cost Direct Common / indirect Varies with activity level Same at all activity level Recovered first Contribution after recovery of Variable Cost Selling price recovers variable cost fully and fixed cost partly.
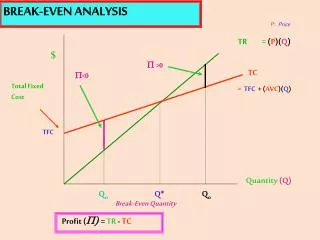
What is Break Even Analysis ? Actual profit starts only after the fixed cost is recovered fully from the contribution. Once the fixed cost is recovered fully, the contribution then contributes towards the profit. The situation where the fixed cost is recovered fully is region of no profit no loss. It is known as Break even point. The actual profit starts only after the Break even is reached.
Y Break Even Chart FC BEP = ----------- SP - VC 200 - 175 - 150 - 125 - 100 - 75 - 50 - 25 - (0,0) Selling price Total cost BEP Fixed Cost Cost / Sales in Rs | | | | | | | 100 200 300 400 500 600 700 X Activity level
How does Break Even Analysis Helps Manager ? • To decide sales volume needed to attain target profit • Change in selling price decision • Decision to expand the capacity • Product drop decision • To study effect of alternative prices
Alternate prices Y SP 1 200 - 175 - 150 - 125 - 100 - 75 - 50 - 25 - (0,0) SP 2 SP 3 Total cost BP 3 BP 2 BP 1 Fixed Cost Cost / Sales in Rs | | | | | 100 200 300 400 500 X Activity level
Drawbacks of Break Even Analysis • Product cycle • Technology absolance • Cots , revenue relationship is not linear Factors that affect Break Even • Change in government policy • Change market scenario • Change in customer perception • Political influences etc. • Change in economy
Need for new model The break even analysis done in this way is known as Accountant’s break even analysis as no economic and other factors are taken into consideration. Organisations generally work only on the basis of Accountant’s break even analysis and suffer in long run.
Economist’s model of Break-Even Analysis The Economist’s model of break-even analysis assumes that costs and revenues are curvilinear. The revenue curve is expected to indicate that the firm is able to sell increasing quantities only by reducing the prices.
Total Cost LOSS B 2 Selling price B 1 LOSS Fixed Cost Economist’s model of Break-Even Analysis Y 200 - 175 - 150 - 125 - 100 - 75 - 50 - 25 - (0,0) PROFIT X Cost / Sales in Rs Optimum Level | | | | | 100 200 300 400 500 Activity level
How it differs from accountant’s model • Economist’s treat costs and revenue as curvilinear whereas accountants treat them as linear • Economist’s break even chart indicates two break even points whereas accountant’s break even chart shows only once, which indicates that after reaching the break even the further sell will always generate profit, which is not true. • From the profit range shown in the economist’s break-even chart, an optimum level of operation can be found This is not possible from an accountant’s break even chart.
Case study Case # 1 Fabric online Case # 2 Tata Indica Case # 3 Intel Case # 4 Reliance Infocom
Case study Case # 1 Fabric online
Interior view Interior view is a traditional chain of retail store, run by Judy Williams, at Western US. The shop is featuring home décor, fabrics, accessories and antique. The company developed a website www.fabric.online.com, with a view extending the reach of the store to those outside the local market and add to the store to the retail base.
The sale for the year 2002 was : Initially Judi was very happy that her sale was increased by $ 20,050 due to the online trading, which inturn increased the Gross margin by $ 9,905.
So the company’s aim was to increase their sale volume Demographic, psycholographic and behavioural characteristics were observed by the company, it was observed that : • Professional Youngsters are expected to be the most likely of the targeted segment. • The online fabric shoppers most often find the site through search engines. • The internet learners represents all of the targeted segments The online sale was increased from 150 units to almost 250 units .
The net result shown in 2003, as compared to 2002 was as under :
Considering the fixed and variable cost of the online trading, the actual working is :
Case study Case # 2 TATA Indica
Introduction • Available in standard and luxury versions • Dec.1998 Tata Indica Launched • Designed with assistance from IDEA and LE MOTEUR • Telco has produced this engineering marvel in a record time of 31 months • 1700 crore factory Built in a 168 acre plot
Market Position • Tata is positioned the Indica head on with Maruti 800 • At the Time of Launch Telco’s main steam business i.e. commercial vehicle segment passing through a cruelest period
Breakeven Analysis • Break Even estimated in December 1998 was 60,000 cars. • In May 2000 break even quantity revised to 90,000 as Telco’s operating profit margin fell 2.4% to 6%. • Cost saving measures adopted • Efforts to improve Working capital. • Borrowings Scale down by 441 crore to 3,004 crore
Break Even Point • Launched in 1998 Break even achieved in the Ist quarter of 2001-2002 • Break even point down from 60000 cars to 53000 cars. • Launched of V2 diesel and petrol version in 2001 • Factors responsible for B.E.P
Case study Case # 3 Intel Corporation
Intel Corporation Intel Corporation, founded in 1968 is a leading company at US has around 450 products and services in computer software & hardware . Which includes wide range from desktop components, notebook components, server and workstation components, flash memory, networking & communications design components & network connectivity, wireless components & software services etc.
For the year 1993-94 and the estimated cost / revenue statement was as under
The comparative working of estimated and actual was as under :
Benefits : • Break even was reached early • PV ratio was increased to 37% • Lower inspection cost which indicates quality improvement
Case study Case # 4 Reliance Infocomm
The Reliance Empire Reliance Industries is the largest petrochemical and petroleum producer in India and is poised for major growth.
Amazing Facts about Reliance Infocomm • A 15,000 cr. project that kicked off on 28th Dec. • Most popular technology used : CDMA • Plans to offer full bouquet of voice, data, image, value-added services and high quality end-to-end connectivity on nationwide basis. • Provides premium to the Reliance Ind. Ltd. Stock
More Amazing Facts about Reliance Infocomm • Reliance Infocomm plans to achieve its break-even in the first year of launch itself. • Plans to target 12 million customers in its first year of operations. • 6,750 Cr. invested by RIL for a 45 per cent stake in the company. • Present shortfall is approximately 40 per cent of the target market that Reliance Infocomm expects to conquer.
Telecom Landline Demand and Supply (Nov. 02)
Risks for Reliance Infocomm • The company has just launched the project and its results would speak in a few months time. • Wooing customers who already avail the services of giants MTNL, BPL and Orange will be a tough task. • Time for Anil and Mukesh Ambani to prove themselves after the demise of their father and win the trust of the present and future shareholders.
Limitations to Break Even Analysis • Limitation of data , viz. neglect of imputed costs , arbitrary depreciation estimates , and inappropriate allocation of overhead costs . • Relationship between costs and revenues and input bound to change over time. • Costs in a particular period need not be entirely due to the output. • Changes in selling costs are a cause and not result of changes in output .
Limitations to Break Even AnalysisContd… • Realistic calculations need to be made at several price levels to get various total revenue curves. • Break even Analysis is an effective tool for short run use only • Inclusion of too many heads in BE analysis causes both good and bad performance can be buried in the total picture of the group • Factors like technological change , improved management, changes in the scale of the fixed factors of production etc. are ignored.
Case Study Stage in Product Life Cycle Expected Maximum Breakeven period Result at the end of expected breakeven period Strategies adopted to improve Results Results www.fabric .online.com Expansion 1 year (2002-03) Loss $379 Concentrated on advertisement and promotions Online sales increased from 150 to 250. Profit $3950 Tata Indica Launch 2 yrs 3 months 60,000 cars) (Dec1999- march 2001) Cash Break even not achieved Worked towards improvement of company working capital, Scaled down borrowing by 441 crores Break Even achieved at 53000 cars . Operating profit 8.32% Intel (mother board) Existing Product Annual (1992-93) 20% profit New machine installed with additional inspection accessories Operating Profit was 37% much more than the estimated 34% Reliance Infocom New Product 1 year To be observed Target: 12 million subscribers. Low prices ISP High connectivity. To be observed Overview
Conclusion A thorough knowledge of the relationship of costs, price and volume is extremely essential for business executives. They need plan for profits despite of uncertainties created by dynamic nature of consumer needs, the diverse nature of competition , the uncontrollable nature of most elements of cost , and the diverse nature of continuous technological developments. Break even Analysis should be used as an effective tool to guide in decision making and not as a substitute for judgment , logical thinking and common sense.