Download
1 / 21
210 likes | 349 Views
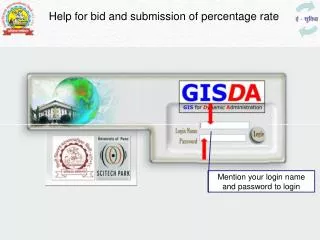
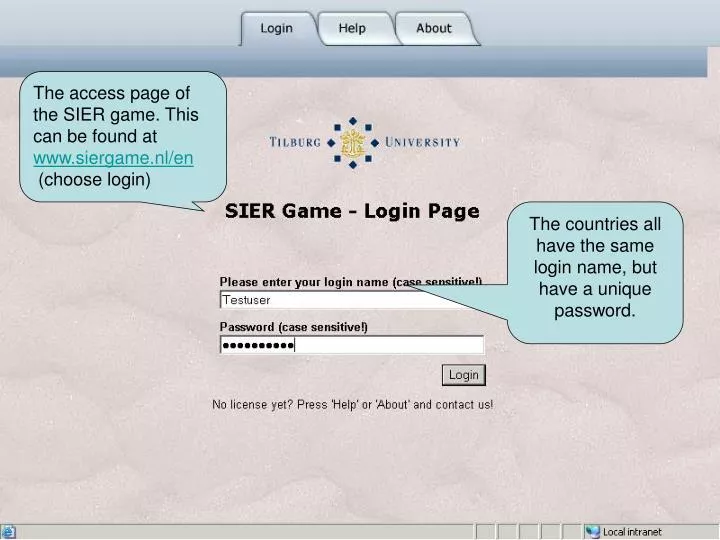
The access page of the SIER game. This can be found at www.siergame.nl/en (choose login). The countries all have the same login name, but have a unique password. Navigation through the game’s pages is done through tabbed pages. The game version determines which pages are available.

E N D
The access page of the SIER game. This can be found at www.siergame.nl/en (choose login) The countries all have the same login name, but have a unique password.
Navigation through the game’s pages is done through tabbed pages. The game version determines which pages are available. The status bar provides succinct information for the game leader and the students.
After login, you may explore several aspects of the starting position: welfare components...
...the policies pursued in one’s own country and in all other countries...
To play the game, go to the ‘Policy’ tab. The aim of the game is to add welvare and become the country in the world with the highest welfare. The students are governments of the countries and have economic policy tools at their disposal that they may use to attempt to maximise welfare. The may, among other, change tax rates, the level over government consumption and the number of civil servants.
To prevent policy tools from being used inappropriately, you have to obey certain boundaries. This is why the size of policy interventions in each game round is subject to boundaries.
If your team is ready entering your policy interventions, you submit them.
Before the economic consequences of the policy mix can be calculated, all countries must submit their policy intentions. This follows from the interdependency between the economies of the countries. In some versions of the game, these interdependencies only take the form of trade flows, but bilateral capital flows are also possible (depending ojn the game version). As a consequence, the economy of a country is also influenced by policies in the other countries. Countries 1, 3 and 4 have submitted their policies, country 2 has yet to submit.
If all countries have submitted their policies (or if the game leader started a new game period manually), the consequences of the economic policies are calculated. All players are informed when the data for the new period is available via a message in the status bar.
A new game period has begun. The data of previous game rounds remain accessible. You have the possibility to view all available data in 1 file, that can subsequently be easily printed or saved. You may study the economic consequences of your policies. Country 3 has the highest welfare (the citizens of country 3 have the highest welvare and have more than 100.00 welfare points).
By clicking the ‘History’ tab, historical overviews may be accessed You may access the historical overviews of all countries in the world.
There is a possibility to print the historical data or save it.
You may view several graphs for all countries, using the ‘Graph’ tab This graph shows which welfare components have contributed to an increase or a fall in welfare. Country 4 is not performing well: welfare has decline in round 1.
The graphs may be viewed together in one file to facilitate printing. Country 3 did raise welfare. Note: players may view the tables and graphs of all countries. This enables them to learn from the policy mixes of the other countries.
You may access a graph that depicts aggregate supply and demand in the product market. This graph can be used to analyse the main economic developments in their country.
In conjunction with the product market graph, an expert system is available that provides you with the main explanations for the shifts in the supply and demand lines.
After analysing the economic situation in their own country (as well as eyeing other countries), the graphs and the historical context, you are ready to formulate their next period’s policy mix. This closes the policy circle. In this manner, up to a maximum of 24 rounds may be played.