Download
1 / 1
10 likes | 120 Views
Use of 18 F-MISO PET Imaging to Monitor the Response of Colorectal Xenografts to DMXAA C. Oehler-Janne*, J. O'Donoghue, P. Zanzonico, J. Russell, C. Ling, S. Carlin MSKCC, Dept. Medical Physics, New York, NY. 1. Pre- and posttreatment hypoxia imaging in a tumor with late SUV decrease.

E N D
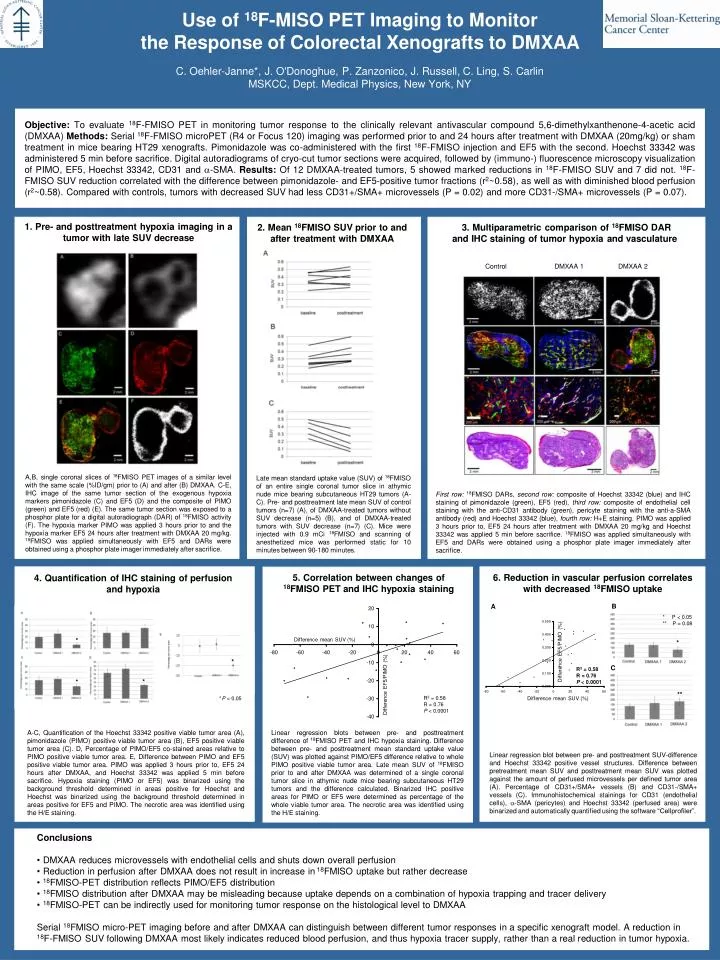
Use of 18F-MISO PET Imaging to Monitor the Response of Colorectal Xenografts to DMXAA C. Oehler-Janne*, J. O'Donoghue, P. Zanzonico, J. Russell, C. Ling, S. Carlin MSKCC, Dept. Medical Physics, New York, NY 1. Pre- and posttreatment hypoxia imaging in a tumor with late SUV decrease 2. Mean18FMISO SUV prior to and after treatment with DMXAA 3. Multiparametric comparison of 18FMISO DAR and IHC staining of tumor hypoxia and vasculature Control DMXAA 1 DMXAA 2 Objective: To evaluate 18F-FMISO PET in monitoring tumor response to the clinically relevant antivascular compound 5,6-dimethylxanthenone-4-acetic acid (DMXAA) Methods: Serial 18F-FMISO microPET (R4 or Focus 120) imaging was performed prior to and 24 hours after treatment with DMXAA (20mg/kg) or sham treatment in mice bearing HT29 xenografts. Pimonidazole was co-administered with the first 18F-FMISO injection and EF5 with the second. Hoechst 33342 was administered 5 min before sacrifice. Digital autoradiograms of cryo-cut tumor sections were acquired, followed by (immuno-) fluorescence microscopy visualization of PIMO, EF5, Hoechst 33342, CD31 and a-SMA. Results: Of 12 DMXAA-treated tumors, 5 showed marked reductions in 18F-FMISO SUV and 7 did not. 18F-FMISO SUV reduction correlated with the difference between pimonidazole- and EF5-positive tumor fractions (r2~0.58), as well as with diminished blood perfusion (r2~0.58). Compared with controls, tumors with decreased SUV had less CD31+/SMA+ microvessels (P = 0.02) and more CD31-/SMA+ microvessels (P = 0.07). A,B, single coronal slices of 18FMISO PET images of a similar level with the same scale (%ID/gm) prior to (A) and after (B) DMXAA. C-E, IHC image of the same tumor section of the exogenous hypoxia markers pimonidazole (C) and EF5 (D) and the composite of PIMO (green) and EF5 (red) (E). The same tumor section was exposed to a phosphor plate for a digital autoradiograph (DAR) of 18FMISO activity (F). The hypoxia marker PIMO was applied 3 hours prior to and the hypoxia marker EF5 24 hours after treatment with DMXAA 20 mg/kg. 18FMISO was applied simultaneously with EF5 and DARs were obtained using a phosphor plate imager immediately after sacrifice. Late mean standard uptake value (SUV) of 18FMISO of an entire single coronal tumor slice in athymic nude mice bearing subcutaneous HT29 tumors (A-C). Pre- and posttreatment late mean SUV of control tumors (n=7) (A), of DMXAA-treated tumors without SUV decrease (n=5) (B), and of DMXAA-treated tumors with SUV decrease (n=7) (C). Mice were injected with 0.9 mCi 18FMISO and scanning of anesthetized mice was performed static for 10 minutes between 90-180 minutes. First row:18FMISO DARs, second row: composite of Hoechst 33342 (blue) and IHC staining of pimonidazole (green), EF5 (red), third row: composite of endothelial cell staining with the anti-CD31 antibody (green), pericyte staining with the anti-a-SMA antibody (red) and Hoechst 33342 (blue), fourth row: H+E staining. PIMO was applied 3 hours prior to, EF5 24 hours after treatment with DMXAA 20 mg/kg and Hoechst 33342 was applied 5 min before sacrifice. 18FMISO was applied simultaneously with EF5 and DARs were obtained using a phosphor plate imager immediately after sacrifice. 5. Correlation between changes of 18FMISO PET and IHC hypoxia staining 6. Reduction in vascular perfusion correlates with decreased 18FMISO uptake 4. Quantification of IHC staining of perfusion and hypoxia B A * P < 0.05 ** P = 0.08 * Difference mean SUV (%) * Difference EF5/PIMO (%) * C R2 = 0.58 R = 0.76 P < 0.0001 * * Difference EF5/PIMO (%) ** R2 = 0.58 R = 0.76 P < 0.0001 * P < 0.05 Difference mean SUV (%) A-C, Quantification of the Hoechst 33342 positive viable tumor area (A), pimonidazole (PIMO) positive viable tumor area (B), EF5 positive viable tumor area (C). D, Percentage of PIMO/EF5 co-stained areas relative to PIMO positive viable tumor area. E, Difference between PIMO and EF5 positive viable tumor area. PIMO was applied 3 hours prior to, EF5 24 hours after DMXAA, and Hoechst 33342 was applied 5 min before sacrifice. Hypoxia staining (PIMO or EF5) was binarized using the background threshold determined in areas positive for Hoechst and Hoechst was binarized using the background threshold determined in areas positive for EF5 and PIMO. The necrotic area was identified using the H/E staining. Linear regression blots between pre- and posttreatment difference of 18FMISO PET and IHC hypoxia staining. Difference between pre- and posttreatment mean standard uptake value (SUV) was plotted against PIMO/EF5 difference relative to whole PIMO positive viable tumor area. Late mean SUV of 18FMISO prior to and after DMXAA was determined of a single coronal tumor slice in athymic nude mice bearing subcutaneous HT29 tumors and the difference calculated. Binarized IHC positive areas for PIMO or EF5 were determined as percentage of the whole viable tumor area. The necrotic area was identified using the H/E staining. Linear regression blot between pre- and posttreatment SUV-difference and Hoechst 33342 positive vessel structures. Difference between pretreatment mean SUV and posttreatment mean SUV was plotted against the amount of perfused microvessels per defined tumor area (A). Percentage of CD31+/SMA+ vessels (B) and CD31-/SMA+ vessels (C). Immunohistochemical stainings for CD31 (endothelial cells), a-SMA (pericytes) and Hoechst 33342 (perfused area) were binarized and automatically quantified using the software “Cellprofiler”. • Conclusions • DMXAA reduces microvessels with endothelial cells and shuts down overall perfusion • Reduction in perfusion after DMXAA does not result in increase in 18FMISO uptake but rather decrease • 18FMISO-PET distribution reflects PIMO/EF5 distribution • 18FMISO distribution after DMXAA may be misleading because uptake depends on a combination of hypoxia trapping and tracer delivery • 18FMISO-PET can be indirectly used for monitoring tumor response on the histological level to DMXAA • Serial 18FMISO micro-PET imaging before and after DMXAA can distinguish between different tumor responses in a specific xenograft model. A reduction in 18F-FMISO SUV following DMXAA most likely indicates reduced blood perfusion, and thus hypoxia tracer supply, rather than a real reduction in tumor hypoxia.


![PET Tracer Coordination [ F-18] labeled](https://cdn3.slideserve.com/6693342/slide1-dt.jpg)