Download
1 / 7
70 likes | 216 Views
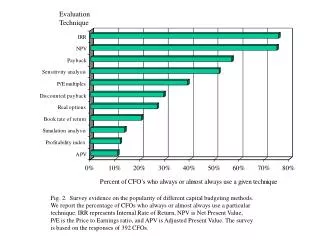
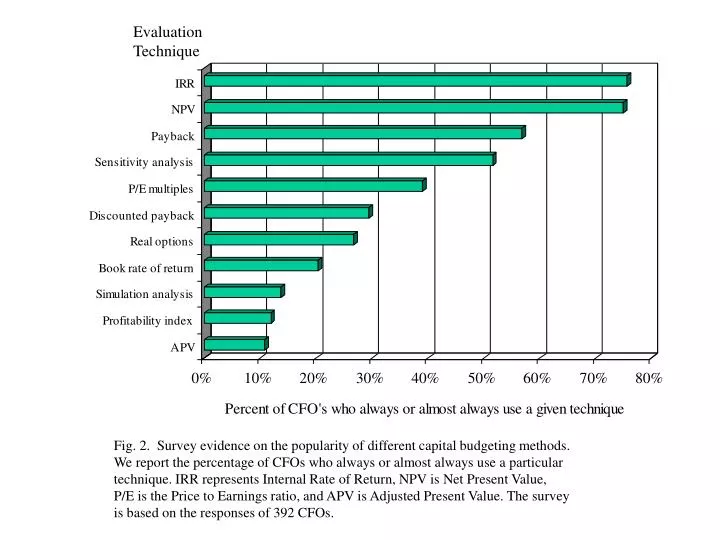
Evaluation Technique. Fig. 2. Survey evidence on the popularity of different capital budgeting methods. We report the percentage of CFOs who always or almost always use a particular technique. IRR represents Internal Rate of Return, NPV is Net Present Value,

E N D
Evaluation Technique Fig. 2. Survey evidence on the popularity of different capital budgeting methods. We report the percentage of CFOs who always or almost always use a particular technique. IRR represents Internal Rate of Return, NPV is Net Present Value, P/E is the Price to Earnings ratio, and APV is Adjusted Present Value. The survey is based on the responses of 392 CFOs.
Cost of equity capital method Fig. 3. Survey evidence on the popularity of different methods to calculate the cost of equity capital. We report the percentage of CFOs who always or almost always use a particular technique. CAPM represents the Capital Asset Pricing Model. The survey is based on the responses of 392 CFOs.
Multibeta risks for adjusting discount rates or cash flows Fig. 4. Survey evidence on types of multibeta risk that are important for adjusting cash flows or discount rates. We report the percentage of CFOs who always or almost always adjust for a particular type of risk. The survey is based on the responses of 392 CFOs.
Debt policy factors Fig. 5. Survey evidence on some of the factors that affect the decision to issue debt. The survey is based on the responses of 392 CFOs.
Fig. 6. Survey evidence on whether firms have optimal or target debt-equity ratios. The survey is based on the responses of 392 CFOs.
Common stock factors Fig. 7. Survey evidence on some of the factors that affect the decision to issue common stock. The survey is based on the responses of 392 CFOs.
Convertible debt factors Fig. 8. Survey evidence on the factors that affect the decision to issue convertible debt. The survey is based on the responses of 392 CFOs.