Download
1 / 53
530 likes | 542 Views
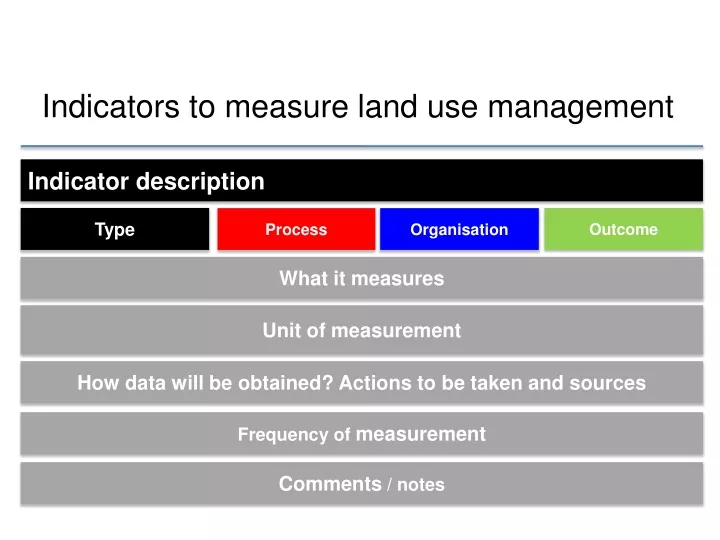
Indicators to measure land use management. Indicator description. Type. Outcome. Process. Organisation. What it measures. Unit of measurement. How data will be obtained ? Actions to be taken and sources. Frequency of measurement. Comments / notes. 1.

E N D
Indicators to measure land use management Indicator description Type Outcome Process Organisation What it measures Unit of measurement How data will be obtained? Actions to be taken and sources Frequency of measurement Comments / notes
1 Total number of building plan applications
2 Time taken to approve building plan applications
3 Ratio between building plan submissions and approvals
4 Number of township development applications submitted
5 Number of township development applications approved
6 Ratio between number of township development applications and approvals
7 Time taken to approve township establishment applications
Process 8 Alignment between SDF and city development strategy and/or growth management strategy
Process 9 Alignment between local level spatial plans and SDF, GMS and CDS
Process 10 Total number of rezoning/ consent use applications
Process 11 Total number of rezoning applications/ consent uses approved and their spatial distribution
Process 12 Ratio between rezoning/ consent use applications and approvals
Process 13 Time taken to approve rezoning/ consent use applications
Process 14 Total number of subdivision/ consolidation applications
Process 15 Total number of subdivisions/ consolidations approved and their spatial distribution
Process 16 Ratio between subdivision/consolidation applications and approvals
Process 17 Time taken to approve subdivision/consolidation applications
Process 18 Alignment between GMS between development control decisions
Process 19 Availability of TP Scheme application guidelines
Process 20 Involvement of stakeholders in local plan-making processes
Process 21 Adaptations of planning proposals as a result of stakeholder consultation processes
Process 22 Alignment/ departure of development applications with city plans
Process 23 Ratio of time taken for appeal vs. statutory requirements
Process 24 Alignment of tribunal review outcomes with strategic planning intentions of City
National & Provincial Planning Municipal Planning Land Use Decisions Joe Shack-dweller Individual/Household Big & Medium Developer National & Provincial Govt Mary Informal Trader
National & Provincial Planning Municipal Planning Influencing Decision Matrix Leading Policy Consents & Approval Permits By-law Enforcement Land Use Decisions Individual/Household Big & Medium Developer National & Provincial Govt Joe Shack-dweller Mary Informal Trader
Divided LUMS Central Strategy Infrastructure Development Transport Planning Planning & Land Use Management Economic Development Housing other functions other functions City & Regional Spatial Planning Investment Promotion Demand & Services Planning Services and Spatial Planning on Available Land Strategic Spatial planning other functions other functions Strategic Projects & Development Facilitation other functions Local Industry Support & Incubation Land Use Planning & Management other functions Activity & Movement in Space
Integrated LUMS Infrastructure Development Transport Planning Planning & Land Use Management Housing Economic Development Central Strategy Demand & Services Planning Investment Promotion Services and Spatial Planning on Available Land City & Regional Spatial Planning Ideal LUMS Activity & Movement in Space Strategic Spatial planning Local Industry Support & Incubation Strategic Projects & Development Facilitation Land Use Planning & Management
Organisation 29 Ratio of university qualified, professionally qualified and postgraduate qualified town planners per head of population
Organisation 30 Comparison of spatial plans with priorities of other departments
Organisation 31 City organogram
Organisation 32 Comparison of City budgets with planning priorities
Organisation 33 Frequency and attendance of strategic planning meetings in departments
Outcome ? Size of new townships as a proportion of size of the city
Outcome ? Rand value of township development applications as a proportion of GVA
Outcome 9 Location of new non-residential developments in former “townships” vs. location of new non-residential developments in other areas
Outcome 10 Physical size of new non-residential developments in former “townships” vs. physical size of new non-residential developments in other areas
Outcome 11 Value of new non-residential developments in former “townships” vs. value of new non-residential developments in other parts of the city
Outcome ? Location of new state-subsidized residential developments relative to former “townships”
Outcome ? Built up area
Outcome ? Population density of cities and spatial distribution of population
Outcome ? Building density of cities and spatial distribution
Outcome ? Building density patterns in response to new transport initiatives (Baseline measure – land use / transport)
Outcome ? Land value in response to new transport initiatives
Outcome ? Land values across built up areas in the city
Outcome 19 Cost of serviced land in the city
Outcome 20 Land tenure
Outcome 48 Number of informal dwellings
Outcome 49 Location of informal dwellings


![[indicator title]](https://cdn3.slideserve.com/6127120/slide1-dt.jpg)