Download
1 / 27
270 likes | 422 Views
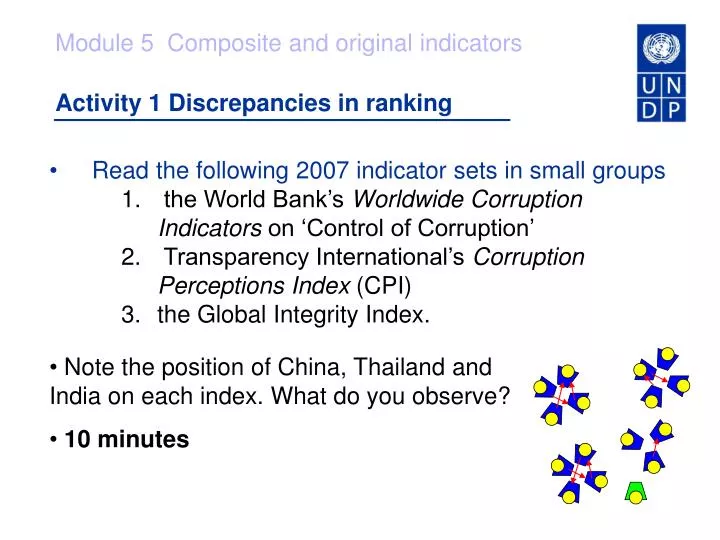
Module 5 Composite and original indicators. Activity 1 Discrepancies in ranking. Read the following 2007 indicator sets in small groups the World Bank’s Worldwide Corruption Indicators on ‘Control of Corruption’ Transparency International’s Corruption Perceptions Index (CPI)

E N D
Module 5 Composite and original indicators Activity 1 Discrepancies in ranking • Read the following 2007 indicator sets in small groups • the World Bank’s Worldwide Corruption Indicators on ‘Control of Corruption’ • Transparency International’s Corruption Perceptions Index (CPI) • the Global Integrity Index. • Note the position of China, Thailand and India on each index. What do you observe? • 10 minutes
Module 5 Composite and original indicators Corruption in China in 2007: 3 indices; 3 stories
Module 5 Composite and original indicators Corruption in China over time (2004-06) Two indices; two stories According to the World Bank, China is doing better in 2006 than it was in 2004 According to TI, China is doing worse in 2006 than it was in 2004
Module 5 Composite and original indicators Activity 2 Disaggregation exercise • Review the worksheets distributed and discuss the following • with your group: • What is each index measuring? • What types of indicators make up the composite score for each index? • What types of data make up each component indicator? • Note feedback on flipcharts • 10 minutes
Module 5 Composite and original indicators Corruption in public sector as perceived by “experts” Existence, effectiveness and citizen access to anti-corruption mechanisms, assessed by national experts Corruption in public & private sector (+ some indicators at household level) as perceived by “experts” + opinion polls (incl. NGO experts)
Module 5 Composite and original indicators Activity 1 Discrepancies in ranking Tip 1: Ignore an index’s label and dig underneath • Different scores on 2 different indices does not mean that one index is right and the other is wrong. • Only that the 2 indices are assessing different concepts • Quick tip: 1) Know what want to measure 2) Ignore an index’s “label” 3) Unpack component questions / indicators 4) Which index really measures what you want to measure? 5) Or do you need to generate your own research?
Module 5 Composite and original indicators Activity 1 Discrepancies in ranking What data makes up the Corruption Perceptions Index?
Module 5 Composite and original indicators Annual variations in methodology Rank: 71th Out of 145 9 surveys – out of 12 16 surveys – out of 18 Rank: 70th Out of 163 14 surveys – out of 16 Rank: 78th Out of 158
Module 5 Composite and original indicators Activity 4 Composite and original indicators • What are the advantages and disadvantages of composite indicators? • What are the alternatives to indices? • Small group work • 5 minutes
Module 5 Composite and original indicators Activity 4 Composite and original indicators • What are the main advantages of composite indicators? • What are the main advantages of original indicators? • What are the alternatives to quantitative assessments?
Module 5 Composite and original indicators Mini-lecture Composite and original indicators • Composite indicators of corruption combine existing indicators into a single measure. This aggregate measure normally ranks a country’s performance on a multi-country index. • International efforts to measure corruption began to take off in the late 1990s with the use of composite indices.
Module 5 Composite and original indicators Mini-lecture Composite and original indicators • Transparency International’s groundbreaking • Corruption Perceptions Index (CPI) • released in 1995 • purpose = a warning bell • Ranks 180 countries by their perceived levels of corruption. • Scale = 0 (highly corrupt) - 10 (highly clean) • Rankings determined by expert assessments and opinion surveys which combine 13 sources covering a period of 2 years (2008 survey).
Module 5 Composite and original indicators Mini-lecture Composite and original indicators • World Bank Institute’s Control of Corruption Indicator • = 1 of 6 Worldwide Governance Indicators (WGI). • produces indicators for 212 countries over the period of 1996 to 2007 • data from 35 separate sources, 25 of which were used for the Control of Corruption indicator
Module 5 Composite and original indicators Mini-lecture Composite and original indicators • Why aggregate? • to reduce measurement error, which can occur when survey responses do not reflect the reality of the wider population. • to widen country coverage, which is necessary for generating broad cross-country comparisons.
Module 5 Composite and original indicators Mini-lecture Composite and original indicators • Criticisms of composites • reliance on third-party data reduces the conceptual clarity of what is actually being measured. • composite indicators, “have no explicit definition, but instead are defined implicitly by what goes into them”. • limited by the available data • variation in data sources helps to explain discrepancies in rankings of a country between different indices
Module 5 Composite and original indicators Mini-lecture Composite and original indicators • Criticisms of composites • wide country coverage inconsistent data coverage, particularly for the poorest countries which are often not included in many underlying data sources. • makes comparison difficult, both between countries and over time, because some data sources are discontinued and new ones become available. • lack of actionability for local stakeholders planning anti-corruption reforms.
Module 5 Composite and original indicators Mini-lecture Composite and original indicators • Multi-country composite indicators useful for providing signals where a country’s performance is slipping or improving • have been used primarily by international donors and investors for making decisions about aid and capital allocations • not designed for informing policy decisions and reforms
Module 5 Composite and original indicators Mini-lecture Composite and original indicators • original indicators of corruption: indicators that are based on originally generated rather than “third party” data. • part of “second generation” of assessment tools which tend to focus on single countries, and also tend to use locally generated data. • major strength = produce highly detailed and contextualized information that can be disaggregated to reveal local nuances (e.g. patterns between corruption incidence and income levels.)
Module 5 Composite and original indicators Mini-lecture Composite and original indicators • based on national surveys of experts and the public • can be single-country in focus, but many repeat methods across countries for comparison: • E.g. Open Budget Index, UNECA’s Africa Governance Indicator, the Global Integrity Index, TI’s Global Corruption Barometer • Weaknesses: • a high degree of contextualization makes cross-country comparisons difficult. • comparability over time necessitates consistent repetition of methods which can be prohibitively costly.
Module 5 Composite and original indicators Activity 5 • How are corruption indicators used in your country? (e.g. for policy making in a specific sector) • What makes an indicator useful for each of these purposes? In your experience, are some indicators more or less useful than others?
Module 5 Composite and original indicators Activity 5 The need for actionable indicators • Actionable indicators: • allow disaggregation to pinpoint bottlenecks within public administration systems • indicate need for corrective action • are based on specific and localized data • measure things that are under the control of policymakers • Policymakers say that global composite indicators are not locally specific enough to tell what needs to be fixed • But some indices are drawn on national sources, and can be useful indicator sources (e.g. TI’s Global Corruption Barometer) • Nonetheless, actionable indicators require locally generated original data, tailored to national priorities
Module 5 Composite and original indicators Activity 6 Identifying actionable indicators • You have been distributed a handout containing indicators drawn from the 3 global corruption indices we looked at earlier: • Corruption Perceptions Index • Worldwide Corruption Indicators on ‘Control of Corruption’ • the Global Integrity Index. • Which, if any, of the indicators on the worksheet is actionable?
Module 5 Composite and original indicators Activity 7 Discussion • Do you find the concept of actionable indicators useful? To what extent is it already a feature of (anti-) corruption monitoring in your country? • “Not everything that can be counted counts.” – Albert Einstein • What are the pitfalls of actionable indicators?
Module 5 Composite and original indicators Activity 7 Action-worthy indicators • Actionable does not mean action-worthy • E.g. Measuring whether a country has an independent anti-corruption commission when there is no guarantee it will reduce corruption • E.g. measuring the speed of judicial proceedings when not clear increasing the speed will ensure justice is done • Risks: measuring things because they are easily measurable, leading to “reform illusion”; attribution of results to an AC intervention can only be estimated, amidst a range of other factors
Module 5 Composite and original indicators Activity 8 Determining what is action-worthy • How does a country determine what is action-worthy? • 10 minutes to discuss
Module 5 Composite and original indicators Activity 8 Determining what is action-worthy • Assessing performance of interventions only makes sense if these are first deemed appropriate for the particular country context • Prior research can identify what reforms to prioritize, and ones that risk further entrenching corrupt systems e.g. political economy studies • Sustained resourcing is required for systematic data collection over time (baselines and periodic monitoring to establish progress and regress)