Download
1 / 19
190 likes | 273 Views
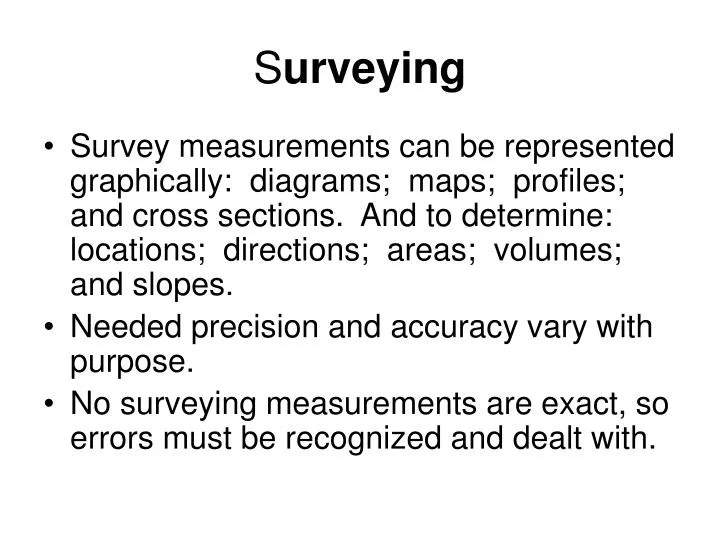
S urveying. Survey measurements can be represented graphically: diagrams; maps; profiles; and cross sections. And to determine: locations; directions; areas; volumes; and slopes. Needed precision and accuracy vary with purpose.

E N D
Surveying • Survey measurements can be represented graphically: diagrams; maps; profiles; and cross sections. And to determine: locations; directions; areas; volumes; and slopes. • Needed precision and accuracy vary with purpose. • No surveying measurements are exact, so errors must be recognized and dealt with.
Slope is the deviation from the horizontal plane. Commonly expressed as feet of vertical change per 100 ft of horizontal distance. When slopes are referred to with drainage they are called grades.
Slope • Ratio is an expression of a constant change between vertical and horizontal distances. • Percent of slope - determined by dividing the change in elevation by horizontal ground distance and multiplying by 100. • Degree of slope is an expression of angular measurement equal to the central • angle of the circumference of a circle.
Distance • Horizontal distance (l) is the straight line distance measured on a horizontal plane. Measured by pacing, wheels, tapes or by electronic distance measuring equipment. • Vertical distance (h) is the measurement of the difference in height or elevation. Measured by altimeter, transit, plumb line and tape, or differential leveling.
Other methods • Global Positioning Systems (GPS) are becoming more commonly used in surveying. • Aerial Surveys (Photogrammetric Surveying) can be used to provide accurate digital representation of sites.
Leveling • Line Level is a small level bubble enclosed in a metal case, which can be hooked over a taut string.
Leveling • A Hand Level is a telescope with cross-hairs and a level bubble.
Leveling • Transit levels are composed of a tripod with a telescope, containing horizontal cross-hairs, and a frame that can be adjusted to the telescope tube will remain level in all directions.
Characteristics of Contours Lines • Same Elevation • Contour closing – hill or depression • Do not cross • Uniform slopes – equal spacing • Valleys – point up hill • Close – steep • Far apart -
Valley Hill Depression
Map Interpretation • U.S. Geological Survey (USGS) Topographic Maps • www.topozone.com • The scale represents units on the map to units on the land surface. • For example, a scale of 1:24,000 means that one inch on the map represents 24,000 inches (2000 ft) along the land surface.
Watershed Delineation • A watershed is defined as the area of land that drains to a given point. • Precipitation falling within the watershed will evaporate, infiltrate into the soil, or run off. • The first step in defining the watershed boundary is to locate the design point and identify the streams, valleys, and hills, which slope toward that point.
Watershed Delineation • Water will flow downhill, perpendicular to the contour lines. • The next step is to delineate the contributing drainage area by identifying the high elevation points with a line that starts and ends at the design point
Soil Texture • Size or combination of sizes of the soil particles • Influences how much water soaks into the soil versus how much runs off the surface • and the ability of a soil to hold water. • Generally, soils consist of varying percentages of clay, silt, and sand, and names such as sandy loam, silty clay, and clay loam.
Soil Infiltration and Transmission Rates The infiltration rate is the rate at which water enters the soil at the surface and is controlled by surface conditions. The transmission rate is the rate at which the water moves through the soil and is controlled by the soil layers. Soil scientists have assigned all soils to one of four hydrologic groups based on infiltration and transmission rates
County Soil Surveys http://www.mi.nrcs.usda.gov/


![CP = E[ s 2 , s 5 , s 1 , s 3 , s 2 ’ , s 3 ’ , s 4 , s 1 ’ , s 4 ’ , s 5 ’ ] S[] I[]](https://cdn3.slideserve.com/6546826/slide1-dt.jpg)