Download
1 / 16
160 likes | 256 Views
CDIAC Data Activities and Projects: Climate Database Compilation and Analysis Dale Kaiser. CDIAC User Working Group Meeting September 27-28, 2010, Oak Ridge, Tenn. Nature of CDIAC climate work Key CDIAC climate databases Examples of CDIAC value-added climate database work

E N D
CDIAC Data Activitiesand Projects:Climate DatabaseCompilation and Analysis Dale Kaiser CDIAC User Working Group Meeting September 27-28, 2010, Oak Ridge, Tenn.
Nature of CDIAC climate work • Key CDIAC climate databases • Examples of CDIAC value-added climate database work • CDIAC climate change research • Collaboration with other institutions • Requests for climate information in the wake of the climate emails controversy • Future plans Presentation Outline
Nature of CDIAC climate work • CDIAC climate work is a combination of: • Dataset assessment, acquisition, documentation, quality assurance, publication, distribution, and archival • Creating value-added products from these datasets • Regional-scale climate change analysis using instrumental data from the past 50 to 100 years
Nature of CDIAC climate work • Smaller-scale projects focusing largely on high-visibility/impact regional and global datasets of interest to many types of users • Emphasis on high quality data and documentation that is user-friendly • Many data holdings have roots in long-standing DOE and NOAA projects, some with international ties (examples to be shown) • Evolving to support climate modeling, carbon cycle, and ecosystem modeling communities where possible
Key CDIAC climate databases • U.S. Historical Climatology Network (supporting NOAA’s NCDC) • Global cloudiness database of Hahn and Warren • Historical Russia and China monthly and daily data • Global and hemispheric near-surface and upper air temperature time series (Jones-CRU; Hansen-NASA/GISS; Angell-NOAA) • Isotopic temperature reconstructions from Antarctic ice cores
Examples of CDIAC value-added • climate database work
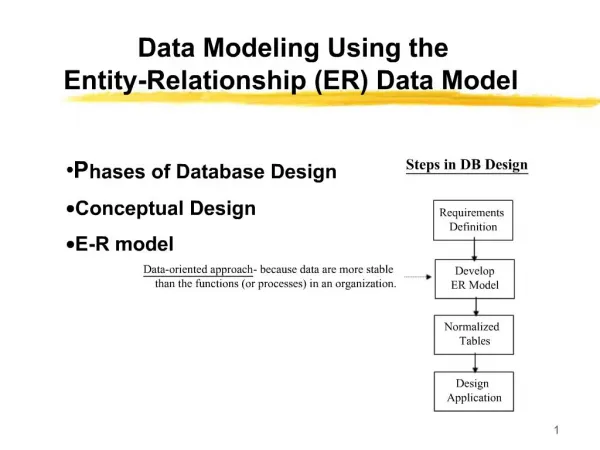
Examples of CDIAC value-added • climate database work A Day-of-Year Temperature Records Atlas for USHCN Stations (in progress) Temporal distribution of record high temperatures at Hendersonville, NC “Record High Temperatures Far Outpace Record Lows Across U.S.” DJF MAM JJA SON
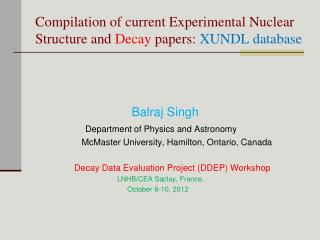
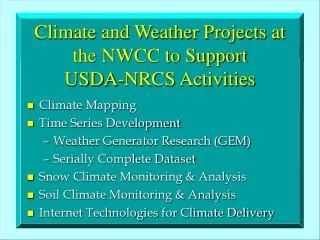
CDIAC climate change research • “False Spring” study conducted in wake of Spring 2007 “Easter Freeze” in much of eastern U.S. (Marino et al.) • Analysis of cloud amount trends over China [several Kaiser (ORNL) and Qian (PNNL) papers in recent years with another coming soon] • Assessment of re-analysis daily extreme temperatures with China’s homogenized historical dataset during 1979 to 2001 using Probability Density Functions, by Jiafu Mao, Xiaoying Shi, Lijuan Ma, Dale P. Kaiser, Qingxiang Li, and Peter E. Thornton. Accepted by J. Climate, June 2009.
CDIAC climate change research “False Spring” study
CDIAC climate change research • China cloud amount trends • About 5 papers published – many with Y. Qian of PNNL - since data first obtained from China Met. Admin. Cited often, including in last two IPCC reports. • Evidence of strong decreases in cloud amount at same time that direct solar radiation has also been decreasing. (Explained by huge anthropogenic aerosol loading; many papers, including ours.) • Current study looks more closely at whether decreasing cloud amount trend is “real” – see following slides from recent Amer. Met. Soc. presentation • This work submitted to Geophys. Res. Lett.
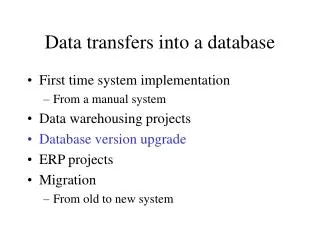
Decreasing Trends in Surface-observed Total Cloud Amount over China:Another Effect of Anthropogenic Aerosol Loading? Dale Kaiser Carbon Dioxide Information Analysis Center Environmental Sciences Division Oak Ridge National Laboratory Yun Qian Pacific Northwest National Laboratory NASA SeaWIFS image 11/20/1999 22nd Conference on Climate Variability and Change 90th Annual Meeting of the American Meteorological Society Atlanta, Georgia 17–21 January 2010
Decreasing Trends in Surface-observed Total Cloud Amount over China: Another Effect of Anthropogenic Aerosol Loading? Trends in annual mean foo (0 to 10 tenths) over all hours, 1954-1998 (percent occurrence per decade) ANN
CDIAC climate change research China cloud amount trends
Collaboration with other institutions • NOAA/NCDC (Menne et al., USHCN) • NOAA/Air Resources Lab. (J. Angell) • PNNL (Qian, China cloud analysis) • All-Russian Research Institute for Hydrometeorological Information (RIHMI) • Russian climate databases quality assured, documented, and distributed by CDIAC; probably will continue • Meeting in Obninsk in 2008, with U.S. False Spring presentation given at Roshydromet Headquarters in Moscow • China Meteorological Administration • Did not attend last two meetings in China; reassessing our involvement due to slowdown/difficulties in acquiring updated China data that CDIAC can freely distribute • Climatic Research Unit, University of East Anglia, UK (Phil Jones) • NASA/GISS (Jim Hansen)
Requests for climate information in the wake of the climate emails controversy • Many email questions regarding: • Greenhouse effect of water vapor vs. carbon dioxide • Magnitude of recent temperature trends compared to those derived from ice cores - “Climate has always been changing, so what’s the big deal lately?” • How can we trust the “hockey stick”? • Discussions with Phil Jones of CRU regarding what underlying station climate data CDIAC might have from analyses we published and distributed for Phil in 1980s and early 1990s. • Tom Karl called us to see if we had any additional information regarding details on Chinese urban/rural stations and changing thermometer heights over time. The famous Karl et al. (1993) BAMS paper on decreasing diurnal temperature range apparently made a few claims that climate change skeptics wanted more info. on
Future Plans • Databases • Global cloudiness database data formats are difficult to work with; convert at least gridded cloud fraction to netCDF to assist modelers • Update cloudiness database as additional data provided by Hahn and Warren. Potentially host their online atlas at CDIAC (now at U. Wash.) • Resume conversion of USHCN daily data to netCDF • Contribute cloudiness and USHCN netCDF data to ESG? • Attend U.S.-Russia meeting at NCDC in May 2011 and also acquire updates to Russian monthly and daily databases • Annual updates to key databases, e.g., USHCN monthly/daily data and global temperature trend time series • Research • Leverage the U.S. day-of-year temperature records atlas for an analysis to be submitted to a journal • Expand the China cloud amount analysis by bringing in the best satellite to further sort out trends questions • Ad hoc climate data assistance to other ORNL research staff