1 / 38

Advanced Plotting Techniques: Subplots, Bar Charts, Area Charts, and Stem Plots

This chapter explores various advanced plotting techniques in MATLAB, including subplots, bar charts, area charts, and stem plots. Learn how to visualize data in different formats and create visually appealing plots using MATLAB.

charlesk
Download Presentation

Advanced Plotting Techniques: Subplots, Bar Charts, Area Charts, and Stem Plots

An Image/Link below is provided (as is) to download presentation Download Policy: Content on the Website is provided to you AS IS for your information and personal use and may not be sold / licensed / shared on other websites without getting consent from its author. Content is provided to you AS IS for your information and personal use only. Download presentation by click this link. While downloading, if for some reason you are not able to download a presentation, the publisher may have deleted the file from their server. During download, if you can't get a presentation, the file might be deleted by the publisher.

E N D

Presentation Transcript


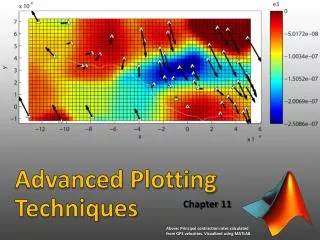
  1. Chapter 12 Advanced Plotting Techniques

  2. FIGURE 12.1 Subplot to display plot, bar, area, and stem plots.

  3. FIGURE 12.2 Data from a matrix in a bar chart.

  4. FIGURE 12.3 Stacked bar chart of matrix data.

  5. FIGURE 12.4 Histogram of data.

  6. FIGURE 12.5 Pie chart showing percentages.

  7. FIGURE 12.6 Pie chart with labels from a cell array.

  8. FIGURE 12.7 Plot versus semilogy.

  9. FIGURE 12.8 Subplot demonstrates varying widths in a bar chart.

  10. FIGURE 12.9 Exploding pie chart.

  11. FIGURE 12.10 Three-dimensional plot with a grid.

  12. FIGURE 12.11 Three-dimensional bar chart.

  13. FIGURE 12.12 Three-dimensional bar chart of a spiral matrix.

  14. FIGURE 12.13 Three-dimensional pie chart.

  15. FIGURE 12.14 Mesh plot of sphere.

  16. FIGURE 12.15 Surf plot of sphere.

  17. FIGURE 12.16 Surf plot of sphere with FaceAlpha modified.

  18. FIGURE 12.17 Use of meshgrid for f(x,y) points.

  19. FIGURE 12.18 A line object with modified line width and color.

  20. FIGURE 12.19 Use of line to draw a circle.

  21. FIGURE 12.20 A line object with a text box.

  22. FIGURE 12.21 Text box with a modified edge color and background color.

  23. FIGURE 12.22 A rectangle object.

  24. FIGURE 12.23 Rectangle object with curvature.

  25. FIGURE 12.24 Simple patch.

  26. FIGURE 12.25 Patch object.

  27. FIGURE 12.26 Varying patch colors.

  28. FIGURE 12.27 Rotated patch object.

  29. FIGURE 12.28 Subplot showing different file types with their names as titles.

  30. FIGURE 12.29 Subplot with customized x-axis tick labels.

  31. FIGURE 12.30 Bar and pie charts with labels from file data.

  32. FIGURE 12.31 Sin with color and line width.

  33. FIGURE 12.32 Horizontal stacked bar chart of median incomes and home prices.

  34. FIGURE 12.33 Varying rectangle curvature.

  35. FIGURE 12.34 Curved rectangles produced in a loop.

  36. FIGURE 12.35 Hockey rink.

  37. FIGURE 12.36 Patch object with black edge.

  38. FIGURE 12.37 Graphics objects to create.

More Related