Download
1 / 28
280 likes | 367 Views
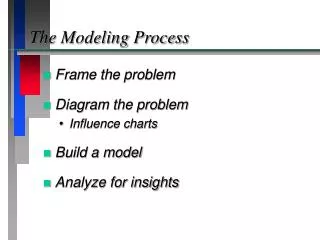
Process Modeling. Modeling System Behavior. 2. State Transition Diagrams. A state transition diagram is a model that depicts a system’s states and the events that cause the system to change states. A state is any observable mode of behavior for the system.

E N D
State Transition Diagrams A state transition diagram is a model that depicts a system’s states and the events that cause the system to change states. A state is any observable mode of behavior for the system. The state transition diagram also shows what actions are taken as a consequence of an event Such models are often called finite state machine models 3
State Transition Diagrams – An Example Following is a state transition diagram for software controlling a printer. In this simplified model, we’ve identified five distinct states: idle, ready, printing, jammed, out_of_paper. The arrows represent transitions from one state to another. Along each arrow we note the event triggering the state change (above the horizontal rule) and the action taken in response to the event (below the horizontal rule). 4
State Transition Example (cont’d) idle trigger action print request ready new job job complete stop printing new job initiate print ready resume job initiate print paper loaded ready resume job printing out_of_paper no paper display paper msg jam corrected ready resume job jammed display jam msg jammed 5
Activity Consider the software that controls the functions of a cruise control device on an automobile. Work with your team to create a state transition diagram for this system. The particular device we’re working has the usual cruise control functions, plus the following enhanced ones: 1) if your vehicle pulls within 50 feet of a vehicle in front of you, an active cruise control device will turn itself off if it is set for more than 45 mph; 2) when you tap the brake once, the cruise control speed is suspended, but may be reinstated by pressing the resume button; 3) if you tap the brake more than once or if you hold the brake down for more than 2 seconds, the cruise control device will turn itself off in which case the speed setting is cancelled and will have to be reset when you re-engage the device. 6
Dialog Maps User interfaces can often be regarded as a finite state machine model Thus, state transition diagrams can be used to model these Such state transition diagrams are referred to as dialog maps (also sometimes called site maps when used with Web development) 7
Dialog Maps as Finite State Machines Each dialog element (menu, screen, dialog box, etc.) can be viewed as a state The user can then navigate to another dialog element (i.e. change states) The possible elements and the navigation paths between them can be modeled as a state transition diagram 8
Dialog Maps – An Example start 1 request to cancel registration access denied transaction terminated cancellation confirmed cancellation not allowed Registration Information Accessed Error Message Displayed Cancellation Performed Cancellation Denied cancellation request update submitted update not allowed try again cancellation data invalid Route Request Modeling User Interaction to Cancel a Seminar Registration in the Seminar Registration System we worked on earlier. 9
Dialog Maps – An Example start 1 request to cancel registration access denied transaction terminated cancellation confirmed cancellation not allowed Registration Information Accessed Error Message Displayed Cancellation Performed Cancellation Denied update submitted update not allowed try again cancellation data invalid cancellation request Route Request Possible Application for a Decision Tree/Table Modeling User Interaction to Cancel a Seminar Registration in the Seminar Registration System we worked on earlier. 10
Activity Consider the Seminar Management System we’ve been working on. Work with your team to create a dialog map that models the seminar administrator’s interactions with the system in obtaining an instructor for a seminar. Refer to the Level 0 DFD for this system on the next slide to refresh your memory about it if needed. 11
Print Vendor eval_request Attendee Email Sys seminar_notification completed_eval request_for_eval seminar_completed Selected Venue instructor_reserved booking_confirmation no_instructor_available booking_denied instructor_request Proposed Seminar Management System SMS booking_request venue_request Accounts Payable venue_pmt_info venue_reserved Seminar Administrator venue_options instructor_pmt_info venue_choice class_roster no_venue_avail available_instrs Seminar Registration System final_roster Instructor Info venues_available inst_scheduled inst_dates scheduled dates_avail Venues Info* email_address roster_sign-in Instructor * Transfer/Maintenance TBD final_roster Attendee Info*
Dialog Maps as Abstraction of User Interface Dialog maps can be viewed as high-level abstractions of user interfaces Show the dialog elements and navigational links among them They do not reveal, or even take into account, detailed screen designs or data field definitions 13
Dialog Maps and Prototypes A dialog map makes a good preliminary model to use before beginning the construction of a prototype Provides vehicle for a high-level discussion with users about the interface functionality -- without getting bogged down in screen appearance and data definition details Excellent model for discovering missing requirements and misunderstood requirements relative to user interactions 14
Specifying Function Define how data changes as it flows through the system Identify the transformations (or functions) that must be performed on data to implement these changes Specify performance targets where appropriate The use of Data Flow Diagrams (DFDs) is one of the most popular functional modeling techniques 16
Data Flow Diagrams (DFDs) The emphasis in data flow modeling is on modeling function (i.e. the process that enables the flow of data) We’ve seen some examples of this technique already in our use of Level 0 DFDs 17
Example Level 0 Data Flow Diagram Employee employee_data payroll_parameters Proposed Hourly Payroll System Hourly Employees Corporate Payroll System hours_worked weekly_ payroll_ summary weekly_check weekly_payroll_report Plant Manager
payrate_parameters Employee Corporate Payroll System employee_data Hourly Employees ded_parameters 2 Compute Gross Pay gross_pay hours_worked Compute Deductions hrs_emp-data 3 Match Hours & Emp_Data weekly_payroll_summary 1 ded_data 7 deductions Create Reports 4 Prepare Check Data weekly_check 5 Print Check weekly_payroll_report payroll_data 6 Tabulate Summaries check_data Plant Manager Payroll System Level 1 Data Flow Diagram
Abstraction and Refinement with DFDs Abstraction understand overall structure organize details within structure problem Refinement 20
Activity With your team, identify the major processes you might like to have in the Level 1 DFD – use the Payroll Example for a guide if needed. Once we reach a consensus on these, we will break the work up. Each team should choose two of these processes and develop all the inputs and outputs they would have. Keep in mind that you may show some internal flows that didn’t appear on the Level 0 DFD, and you may also show more detail in the data flows at this level than you had on the Level 0 DFD. All data flows used should be consistent with those we used in the Level 0 DFD Recall the Level 0 DFD for our Seminar Management System from the previous class (given on the next slide). Let’s consider the steps we might take to refine this into a Level 1 DFD. 21
Print Vendor eval_request Attendee Email Sys seminar_notification completed_eval request_for_eval seminar_completed Selected Venue instructor_reserved booking_confirmation no_instructor_available booking_denied instructor_request Proposed Seminar Management System SMS booking_request venue_request Accounts Payable venue_pmt_info venue_reserved Seminar Administrator venue_options instructor_pmt_info venue_choice class_roster no_venue_avail available_instrs Seminar Registration System final_roster Instructor Info venues_available inst_scheduled inst_dates scheduled dates_avail Venues Info* email_address roster_sign-in Instructor * Transfer/Maintenance TBD final_roster Attendee Info*
Workflow Diagrams A workflow diagram shows a high-level view of a business process, indicating steps, inputs, and outputs These do not typically attempt to show any decisions The swimlane variant of the workflow diagram shows participants (people or systems) responsible for carrying our various steps Each participant has its own swimlane 23
Workflow Diagrams Useful for analyzing existing business processes Can show impact on existing processes of requested changes Can identify opportunities for process improvement Can model process changes or new processes 24
Workflow Diagram Example (with swim lanes) Process Name: Complete an Online Customer Order swim lanes Input: Customer profile information, including billing and shipping information submit order start sign in Customer confirm available confirm payment Order Approval Inventory check inventory adjust inventory Order Fulfillment pack order assemble order Shipping ship order stop Output: Shipping bill and tracking information 25
Activity Consider the Seminar Management System we’ve been working on. Work with your team to create a workflow diagram (with swim lanes) for the process of scheduling a seminar venue. Note that this process should include the preliminary process/activity of obtaining an instructor. Refer to the earlier Level 0 DFD for this system to refresh your memory about it if needed. 26
Writing Requirements With your team, utilize the Level 0 DFD and the workflow diagram the team created to write a draft of the business requirements for the Seminar Management System. Organize the requirements in categories to make them easier to read and change as necessary. 27
Review of Key Learning Outcomes When you complete this course you will be able to: Describe why models are useful in discovering business requirements Explain how the two concepts of abstraction and refinement work within modeling to help manage complexity Identify the three major views of systems used in modeling Give examples of some types of models that are common for these views Explain and use state transition diagrams to model system behavior Explain and use dialog maps to model user interaction with a proposed system Relate dialog maps and prototyping Explain and use Level 0 and Level 1 Data Flow Diagrams to model system functionality Explain and use workflow diagrams to model business processes Explain and use swimlanes with workflow diagrams Show how models can be used to help create and validate business requirements 28