Download
1 / 34
350 likes | 463 Views
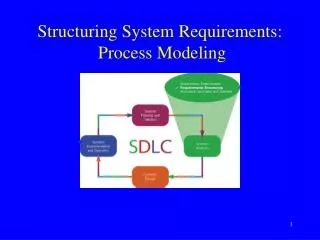
System Process Modeling. DATA Flow Diagrams. System Models. System models play an important role in systems development. Systems analysts or users constantly deal with unstructured problems. One way to structure such problems is to draw models.

E N D
System Process Modeling DATA Flow Diagrams
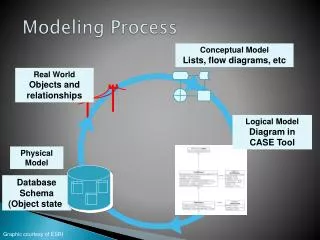
System Models • System models play an important role in systems development. • Systems analysts or users constantly deal with unstructured problems. • One way to structure such problems is to draw models. • A model is a representation of reality. Just as a picture is worth a thousand words, most system models are pictorial representations of reality.
What is Process Modeling? • Process modeling is a technique for organizing and documenting the structure and flow of data through a system’s processes. • A business user, when questioned will usually focus on the processes of that operation. • A process may be defined as an action or series of actions which produce a change or development. • The process view of a system may be modeled by a Data Flow Diagram
A data flow diagram (DFD) is a “graphical representation of the flow of data through a system”(Martin, 1995) Data Flow Diagram • Graphical descriptions of the sources and destinations of data. They show: • Where data comes from • How it flows • The processes performed on it • Where it goes
DATA FLOW DIAGRAMS • A data flow diagram (DFD) graphically describes the flow of data within an organization. It is used to: • Document existing systems • Plan and design new systems • An ERD is a data model, and a DFD is a process model
DATA FLOW DIAGRAMS • A data flow diagram consists of four basic elements: • Data sources and destinations. Also called external entities • Data flows • Processes • Data stores
DATA FLOW DIAGRAMS • Data sources and destinations (External entities) • Appear as squares • Represent organizations, individuals, or organizational units that send or receive data used or produced by the system • An item can be both a source and a destination • Used to define system boundaries • Named with a noun
DATA FLOW DIAGRAMS • Data flows • Appear as arrows, named with nouns • Represent the flow of data between sources and destinations, processes, and data stores • A data flow can be used to represent the creation, reading, deletion, or updating of data in a file or database (data store). • At least one end of every data flow should either come from or go to a process.
DATA FLOW DIAGRAMS • If two data elements flow together, then the use of one data flow line is appropriate. Process Payment Customer Cash Rec’t & Remittance Slip
DATA FLOW DIAGRAMS • If the data elements do not always flow together, then multiple lines will be needed. Process Payment Customer Customer Inquiry Customer Payment
DATA FLOW DIAGRAMS • Processes • Appear as circles • Represent the transformation of data • Must be numbered and labeled with a single action verb and an object • Avoid the use of the word “and” in the process name
Accounts Receivable DATA FLOW DIAGRAMS • The processes are shown in red. • Every process must have at least one data inflow and at least one data outflow. 1.0 Process Payment 2.0 Update A/R Customer payment Customer Receivables Information Remittance data Credit Manager Deposit Bank
DATA FLOW DIAGRAMS • Data stores • Appear as two horizontal lines, named with a noun • Represent a temporary or permanent data repository • Flow out of a data store = retrieval • Flow into a data store = inserting or updating • Data stores on a DFD are related to entities on an ERD
DATA FLOW DIAGRAMS • Subdividing the DFD: • Few systems can be fully diagrammed on one sheet of paper, and users have needs for differing levels of detail. • Consequently, DFDs are subdivided into successively lower levels to provide increasing amounts of detail. • Some data inputs and outputs will not appear on the higher levels of the DFD but appear as the processes are exploded into greater levels of detail.
DATA FLOW DIAGRAMS • The highest level of DFD is called a context diagram. • It provides a summary-level view of the system. • It depicts a data processing system and the external entities that are: • Sources of its input • Destinations of its output • The process symbol is numbered with a “0”
DATA FLOW DIAGRAMS Govt. Agencies Depart- ments Tax report & payment Time cards Payroll Processing System Employees 0 Employee checks Payroll check New employee form Bank Employee change form Human Resources Payroll report • This is the context diagram for the S&S payroll processing system (Figure 3-5 in your textbook). Manage- ment
DATA FLOW DIAGRAMS • A Level 0 diagram is a projection of the process on the Context diagram. It is like opening up that process and looking inside to see how it works – to show the internal sub-processes • On a Level 0 diagram, you repeat the external entities but you also expand the main process into its subprocesses. Also data stores will appear at this level. • The Level 0 diagram must “balance” with the Context diagram. This means they should both have the same external entities with the same flows to and from those entities.
Employee/ Payroll file General Ledger DATA FLOW DIAGRAMS Depart- ments Employees Employee checks Human Resources New employee form Time cards 1.0 Update empl. Payroll file 2.0 Pay Employ- ees Employee Change form Payroll check Bank Payroll Disburse- ment data 3.0 Prepare reports 5.0 Update Gen. Ledger This diagram shows the next level of detail for the context diagram in Figure 3-5. Payroll tax disb. voucher Payroll report 4.0 Pay taxes Manage- ment Tax report & payment Govt. Agencies
Employee/ Payroll file General Ledger DATA FLOW DIAGRAMS Depart- ments Employees Employee paychecks Human Resources New employee form Time cards 1.0 Update empl. Payroll file 2.0 Pay Employ- ees Employee Change form Payroll check Bank Suppose we exploded Process 2.0 (pay employees) in the next level. The sub-processes would be numbered 2.1, 2.2, 2.3, etc. Payroll Disburse- ment data 3.0 Prepare reports 5.0 Update Gen. Ledger Payroll tax disb. voucher Payroll report 4.0 Pay taxes Manage- ment Tax report & payment Govt. Agencies
DATA FLOW DIAGRAMS • A Level 1 diagram is a projection of a Level 0 process. • A Level 1 diagram shows all the processes that comprise a single process on the level 0 diagram. • It shows how information moves from and to each of these processes. • Level 1 diagrams may not be needed for all Level 0 processes. • On Level 1 diagrams we do not repeat external entities. Data stores may not be repeated either.
CONTEXT DIAGRAM KITCHEN CUSTOMER 0 Customer Order Food Order Food Ordering System Receipt Management Report RESTAURANT MANAGER
LEVEL 0 DIAGRAM KITCHEN CUSTOMER 1.0 Customer Order Food Order Transform Customer Food Order Receipt 3.0 2.0 Update Inventory Update Goods Sold Inventory Data Goods Sold Data Formatted Inventory Data Formatted Goods Sold Data INVENTORY D2 GOODS SOLD D1 Daily Inventory Depletion Amounts Daily Goods Sold Amounts 4.0 Produce Management Report RESTAURANT MANAGER Management Report
DFD Balance KITCHEN CUSTOMER Customer Order 1.0 Food Order Receipt Transform Customer Food Order 3.0 2.0 Update Inventory Update Goods Sold Inventory Data Goods Sold Data Formatted Inventory Data Formatted Goods Sold Data INVENTORY D2 GOODS SOLD D1 Daily Inventory Depletion Amounts Daily Goods Sold Amounts 4.0 Produce Management Report Management Report RESTAURANT MANAGER
Level 1 Diagram PROCESS 1 ON THE LEVEL 0 DIAGRAM SUB PROCESS 1 THIS LEVEL 1 DIAGRAM 1.3 1.1 Transform Order to Kitchen Format Process Customer Order Customer Order Food Order Customer Order Inventory Data 1.5 Customer Order Generate Inventory Decrements Customer Order Customer Order 1.4 1.2 Generate Good Sold Increments Generate Customer Receipt Goods Sold Data Receipt NOTE HOW WE HAVE THE SAME INPUTS AND OUTPUTS AS THE ORIGINAL PROCESS SHOWN IN THE LEVEL 0 DIAGRAM
Another Level 1 Diagram Daily Goods Sold Amounts Daily Inventory Depletion Amounts 4.0 ORGINAL LEVEL 0 PROCESS Produce Management Report Management Report LEVEL 1 PROCESSES Daily Inventory Depletion Amounts 4.2 4.1 Inventory Data Daily Goods Sold Amounts Access Goods Sold and Inventory Data Aggregate Goods Sold and Inventory Data Goods Sold Data Management Report 4.3 Prepare Management Report PROCESSES 2.0 AND 3.0 ON THE LEVEL 0 DIAGRAM DO NOT NEED FURTHER DECOMPOSTION
DATA FLOW DIAGRAMS • Let’s step through some guidelines on how to create a DFD. • RULE 1: Understand the system. Observe the flow of information and interview people involved to gain that understanding. • RULE 2: Ignore control processes and control actions (e.g., error corrections). Only very critical error paths should be included. • RULE 3: Determine the system boundaries—where it starts and stops. If you’re not sure about a process, include it for the time being.
DATA FLOW DIAGRAMS • RULE 4: Draw the context diagram first, and then draw successively greater levels of detail. • RULE 5: Identify and label all data flows. • RULE 6: Data flows that always flow together should be grouped together. Those that do not flow together should be shown on separate lines. • RULE 7: Show a process (circle) wherever a data flow is converted from one form to another. Likewise, every process should have at least one incoming data flow and at least one outgoing data flow.
DATA FLOW DIAGRAMS • RULE 8: Processes that are logically related or occur simultaneously can be grouped in one process. • RULE 9: Number each process sequentially. A process labeled 5.0 would be exploded at the next level into processes numbered 5.1, 5.2, etc. A process labeled 5.2 would be exploded into 5.2.1, 5.2.2, etc. • RULE 10: Process names should include action verbs, such as update, prepare, etc.
DATA FLOW DIAGRAMS • RULE 11: Identify and label all data stores. • RULE 12: Identify and label all sources and destinations. An entity can be both a source and destination. You may wish to include such items twice on the diagram, if needed, to avoid excessive or crossing lines. • RULE 13: As much as possible, organize the flow from top to bottom and left to right.
DATA FLOW DIAGRAMS • RULE 14: You’re not likely to get it beautiful the first time, so plan to go through several iterations of refinements. • RULE 15: On the final copy, lines should not cross. On each page, include: • The name of the DFD • The date prepared • The preparer’s name
DATA FLOW DIAGRAMS • The first paragraph of the narrative for the payroll process reads as follows: • When employees are hired, they complete a new employee form. When a change to an employee’s payroll status occurs, such as a raise or a change in the number of exemptions, human resources completes an employee change form. A copy of these forms is sent to payroll. These forms are used to create or update the records in the employee/payroll file and are then stored in the file. Employee records are stored alphabetically.
General Ledger DATA FLOW DIAGRAMS Depart- ments Employees Employee paychecks Human Resources New employee form Time cards 1.0 Update empl. Payroll file 2.0 Pay Employ- ees Employee Change form Payroll check Bank Payroll Disburse- ment data 3.0 Prepare reports 5.0 Update Gen. Ledger Employee/ Payroll file Payroll tax disb. voucher Payroll report 4.0 Pay taxes Manage- ment Tax report & payment Govt. Agencies
DATA FLOW DIAGRAMS • The data flow diagram focuses on the logical flow of data.