Download
1 / 93
950 likes | 1.79k Views
The Hydrologic Budget of Wetlands. Jason Hall Robert Lomax Lisa Thatcher November 4, 2003. Overview. Information on hydrology budgets of wetlands Case study of hydrology in a Carolina bay wetland Jason - watershed hydrology of coastal forested wetland of the southern US

E N D
The Hydrologic Budget of Wetlands Jason Hall Robert Lomax Lisa Thatcher November 4, 2003
Overview • Information on hydrology budgets of wetlands • Case study of hydrology in a Carolina bay wetland • Jason - watershed hydrology of coastal forested wetland of the southern US • Lisa - hydrology of a constructed wetland in south Florida, peatland in Wisconsin, and conclusion
Hydrology Budget • Hydrology is probably the single most important determinant of the establishment and maintenance of specific types of wetlands and wetland processes. (Mitsch and Gosselink 1993) • Hydrology describes all inflows and outflows of water, soil contours of the wetland, and subsurface conditions
Hydrology Budget • Hydrologic conditions directly modify or change chemical and physical properties such as nutrient availability, degree of soil anoxia, soil salinity, sediment properties, and pH. • These are major factors in the ultimate classification of the wetland itself as well as the selection of biota. • Small changes in hydrology can result in significant biotic changes.
Hydrology Budget • Three main characteristics: (1) the balance btwn inflows and outflows. (2) surface contours of landscape. (3) subsurface soil, geology, and groundwater conditions • Budget usually described in terms of depth per unit time, e.g., cm/yr or in volume per unit time, e.g., m³/day • animation
V/t = Pn + Si + Gi – ET- So –Go ± T • V = volume of water storage in wetland • V/t = change in volume of water per unit time • Pn = net precipitation • Si = surface inflows, including flooding • Gi = ground water inflows • ET = evapotranspiration • So = surface outflows • Go = groundwater outflows • T = tidal inflow(+) or outflow(-)
Precipitation • Wetlands favor areas where precipitation rates typically exceed evapotranspiration rates • Pn = TF + SF
Surface Inflows • Overland flow: nonchannelized sheet flow, occurs during and immediately following rainfall, spring thaw, or as tides rise. • Stream flow: channelized flow from drainage basin, difficult to determine, often the most important source of water in hydrology budget
Surface Outflows • Either channelized or overland sheet flow
Groundwater • Groundwater inflows and outflows occur when surface water level of wetland is lower hydrologically than the water table of the surrounding land • Different ways this occurs • Described by Darcy’s Law G = k · a · s • G = flow rate of groundwater • K = hydraulic conductivity or permeability • A = groundwater cross-sectional area perpendicular to flow • S = hydraulic gradient ( peizometeric surface )
Groundwater • Groundwater flows are important source of nutrients and dissolved minerals. • Partly responsible for species diversity and richness • Groundwater hydraulics, despite their obvious importance, are still poorly understood
Evapotranspiration • Water that vaporizes from water or soil in wetlands (evaporation), combined with moisture that passes through vascular plants to the atmosphere (transpiration). • Rate of evapotranspiration is proportional to the difference btwn vapor pressure at water surface (or leaf surface) and vapor pressure in overlying air
Evapotranspiration • Enhanced by solar radiation and surface temperature which increase value of vapor pressure at evaporative surface or by reduced humidity and increased wind speed which decrease vapor pressure. • If water is limited, evapotranspiration limited • Transpiration can be limited physiologically by certain plants
Evapotranspiration • Four equations used to describe the rate of evapotranspiration although none entirely satisfactory. • Mainly because climatic conditions as well as vegetation vary btwn wetlands
Tides • Predictable and periodic tidal inundations of coastal salt marshes, mangroves, and freshwater tidal marshes are major hydrologic feature of these wetlands • Salinity, duration and flooding frequency in part determine the abiotic and biotic components of the system
Principles underscoring the importance of hydrologyin wetlands • Hydrology leads to unique vegetation composition but can limit or enhance species richness • Primary productivity and other functions enhanced by flowing conditions and pulsing hydroperiods • Accumulation of organic material controlled by hydrology through influence on primary productivity, decomposition, and export of POM • Nutrient cycling and availability are both significantly influenced by hydrologic conditions.
Hydrologic conditions • Used by scientists to classify these ecosystems • Classification and mapping of wetlands based on biotic features (dominant vegetation) often matches the hydrologic conditions of different wetlands
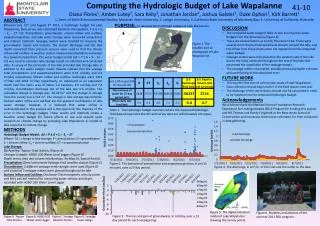
HYDROLOGY, COMMUNITY STRUCTURE, AND PRODUCTIVITY PATTERNS OF A DYSTROPHIC CAROLINA BAY WETLAND
Thunder Bay • Upper coastal plane in SE corner of the 750 - km² Savannah River Plant in Barnwell County, South Carolina. • US Dept. of Energy radioisotope production facility. • Occurs in Lower Three Runs Creek watershed, tributary of Savannah River
Study Site Schalles et. al. 1988
Thunder Bay Shallow 5.4 – ha dystrophic Carolina bay wetland • Stagnant hydrology, dilute/acidic chemistry • Low primary production / low biomass Sharitz 1994
Thunder Bay • Average rainfall over the four year study period was 122.25 cm • Air temperature averaged 18.3°C (8.8°C in Jan. and 27.5°C in Jul) • Growing season is approx. 245 d. • At intermediate water stage, surface elevation was 61 m NGVD (National Geodetic Vertical Datum) • Little to no surface inflows or outflows
Thunder Bay • Soil – dark sandy loam • Underlying clay lens • Surface water extremely dilute (16.7 µS)
Thunder Bay Hydrology • Staff gauge used to take water levels • Surface water level taken with Stevens Type F recorder • Behavior of adjacent, near-surface aquifer monitored with four wells using Type F recorders • Wells CB-1 and CB-3 on south and northeast sides respectively, just outside of bay margin
Hydrology • CB-2 located 360 m southwest and downslope of CB-1 • CB-4 located 270 m northeast and upslope of CB-3
Results • Water levels dynamic and responsive • General absence of peat, periodic pond drawdown and oxidation of exposed soil • Surface water levels varied from 61.30 to 61.85 m NGVD largely due to rainfall. • Avg. surface rate loss varied from 0.12 cm/d in Jan. to 0.76 cm/d in July. • Monthly water loss and surface water temp. had a strong correlation(r = 0.93)
Strong relationship between precipitation and water level. • Amount of rain necessary to offset loss rates was 62 cm/6 – mon period(x-axis intercept of regression line in Fig. 4) Schalles et. al. 1998
This strong correlation btwn surface water levels and precipitation and net water-loss rates and temperature suggests a perched condition • Dilute chemistry of Thunder Bay suggests subsurface hydrologic exchange must exist to maintain long-term chemical equilibrium
Thunder Bay occurs within a persistent groundwater gradient • Upslope CB-4 always had higher water levels than the pond (63.0 – 64.1 m NGVD) and downslope CB-2 lower water levels than the pond(55.7 – 57.7 m NGVD) • Comparisons surface – groundwater levels exhibit connections shown in Fig. 5 • Elevated ground-water levels in winter and spring resulted from increased rain and decreased evapotranspiration.
Groundwater exchange primarily lateral as opposed to vertical due to a clay lens below the wetland • Lateral exchanges may be lost as subsurface and surface levels decline below the contact zone • Total system surface water loss from the Y-axis intercept from Fig. 4 is 80 cm net loss for a precipitation-free, 6-mon period. • Thus total system loss (160 cm/yr) – equilibrium precipitation (124 cm/yr) yields 36 cm/yr which may represent net surface gain from groundwater
References • Mitsch W. J., and Gosselink J. G., “Wetlands 2nd ed.”, 1993, pp 67- 113. • Schalles J.F., and Shure D. J., “Hydrology, Community Structure, and Productivity Patterns of a Dystrophic Carolina Bay Wetland.” Ecological Monographs, 59(4), 1989, pp 365-385. • Sharitz A. B.,1994, University of Georgia., www.uga.edu/srel/ESSite/Sharitz.htm.
A comparison of the watershed hydrology of coastal forested wetlands and the mountainous uplands in the Southern US CASE STUDY AREAS: • BRADFORD FOREST WATERSHED OF NORTHERN FLORIDA • CARTERET 7 WATERSHED OF SE NORTH CAROLINA • COWEETA 14 WATERSHED OF WESTERN NORTH CAROLINA
SITE DESCRIPTIONS BRADFORD FOREST WATERSHED • REPRESENTS A MIXTURE OF ECOSYSTEMS: CYPRESS WETLANDS & SLASH PINE UPLANDS • UPLANDS ARE FLAT & CLOSE IN ELEVATION TO ADJACENT WETLANDS (>1M DIFFERENCE) • UPLANDS: RELATIVELY DRY DUE TO WELL DRAINED SANDY SOILS • CYPRESS WETLANDS: SURFACE WATER IS PRESENT 9 MONTH OF THE YEAR, UNDERLINED BY IMPERMEABLE CLAY LAYERS 3M BELOW GROUND SURFACE
CARTERET 7 WATERSHED • ARTIFICIALLY DELINATED WITH ROADS AND PARALLEL DITCHES • LOW ELEVATION AND TOPOGRAPHY • CLASSIFIED AS POORLY DRAINED WITH HYDRIC SOILS DOMINATED BY FINE SANDY LOAM
WATERSHED 14 AT COWEETA • REPRESENTS AN UPLAND WATERSHED • CLEAR CUT IN 1962 • LOCATED IN SOUTHERN APPALACHIAN MOUNTAINS WHICH ARE DOMINATED NATIVE HARDWOODS *** THESE THREE WATERSHEDS HAVE THE LONGEST CONTINUOUS RECORDS OF HYDRLOGIC RESEARCH IN THE S.E. UNITED STATES
FUNCTIONS WITHIN THE FORESTED WETLANDG.Sun and S.G. McNulty (2002)
KEY FACTORS EFFECTING HYDROLOGIC • BUDGET • EVAPOTRANSPIRATION • GROUNDWATER INFLOWS AND OUTFLOWS • VOLUME OF WATER STORAGE • SURFACE INFLOWS & OUTFLOWS • NET PRECIPITATION • TIDAL INFLOW & OUTFLOW
QUESTIONS ADDRESSED BY THIS STUDY 1. Is actual evapotranspiration (AET) from pine flatwoods close or equal to potential forest evapotranspiration (PET) in the long-term? And, is upland forest AET is far less than PET? 2. In the long-term, what caused the hydrologic differences (streamflow/precipitation ratio) among the wetland and upland watersheds, topographical features or climate?
POTENTIAL FOREST EVAPOTRANSPIRATION (PET) • The total maximum possible water loss from a forest ecosystem through evApotranspiration. • (PET) IS DETERMINED BY TEMPERATURE, DAY TIME HOURS AND SATURATED VAPOR PRESSURE. • HAMON’S METHOD (PET=0.1651XDAYLXRHOSATXKPEC) • ACTUAL WATER LOSS THROUGH INTERCEPTION AND TRANSPIRATION WAS LESS THAN (PET) UNDER WATER STRESS CONDITIONS DURING THE GROWING SEASON. ACTUAL EVAPOTRANSPIRATION (AET) • DIFFERENCE BETWEEN MEASURED AVERAGE ANNUAL PRECIPITATION AND STREAM FLOW FOR EACH WATERSHED.
DATA COLLECTION • DAILY STREAM FLOW • TEMPERATURE • RAINFALL DATA • USED TO DETERMINE FLOW PATTERNS, PET AND ANNUAL WATER BUDGET.
FLOW PATTERNS • OUTFLOW FROM BRADFORD FOREST WATERSHED (FL) AND CARTERET WATERSHED(NC) STOPPED DURING SPRING AND SUMMER MONTHS WHEN PET AND AET INCREASED. • WETLAND STREAM FLOW PATTERNS WERE CONTROLLED BY GROUND WATER STORAGE THAT WAS THE NET RESULT OF RAINFALL AND AET. • HIGH RAINFALL INPUT AND LOW PET AT CARTERET WATERSHED SUSTAINED BASE FLOW DURING NON –RAIN EVENTS. • DEEP SOILS AT COWEETA STORED LARGE VOLUMES OF WATER WHICH MAINTAINED A CONSTANT WATER RELEASE THROUGHOUT THE YEAR. • OVER 75 % OF THE ANNUAL PRECEPITATION RETURNED TO THE ATMOSPHERE AS ET, WHILE STREAM FLOW DECREASED IN THE DRY SEASON AND FLOODED THE ENTIRE WATERSHED DURING THE WET SEASON.
WATER BUDGET FOR BRADFORD FORESTG.Sun and S.G. McNulty (2002)
WATER BUDGET FOR CARTERET 7 WATERSHEDG.Sun and S.G. McNulty (2002)