Download
1 / 35
390 likes | 534 Views
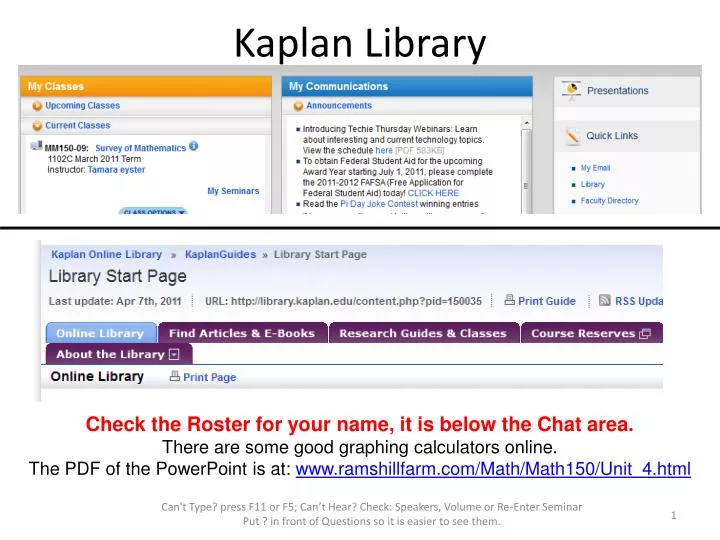
Kaplan Library. Check the Roster for your name, it is below the Chat area. There are some good graphing calculators online. The PDF of the PowerPoint is at: www.ramshillfarm.com/Math/Math150/Unit_4.html. Page 143. 4.1. Variation. Direct Variation.

E N D
Kaplan Library Check the Roster for your name, it is below the Chat area. There are some good graphing calculators online. The PDF of the PowerPoint is at: www.ramshillfarm.com/Math/Math150/Unit_4.html Can't Type? press F11 or F5; Can’t Hear? Check: Speakers, Volume or Re-Enter Seminar Put ? in front of Questions so it is easier to see them.
Can't Type? press F11 or F5; Can’t Hear? Check: Speakers, Volume or Re-Enter Seminar Put ? in front of Questions so it is easier to see them.
Can't Type? press F11 or F5; Can’t Hear? Check: Speakers, Volume or Re-Enter Seminar Put ? in front of Questions so it is easier to see them.
Page 143 4.1 Variation Can't Type? press F11 or F5; Can’t Hear? Check: Speakers, Volume or Re-Enter Seminar Put ? in front of Questions so it is easier to see them.
Direct Variation • Variation is an equation that relates one variable to one or more other variables. • In direct variation, the values of the two related variables increase or decrease together. • If a variable y varies directly with a variable x, then y = kx where k is the constant of proportionality(or the variation constant). Can't Type? press F11 or F5; Can’t Hear? Check: Speakers, Volume or Re-Enter Seminar Put ? in front of Questions so it is easier to see them.
Example The weight on the Earth of an object varies directly to its weight on the moon. If an astronautweighs 155 lbs on the Earth and 24.8 lbs on the Moon. How much would a 85 pound dog weigh on the Moon? WM= gWEWM= gWE 24.8= g155WM= (0.16)85 0.16 = gWM = 13.6 The dog would weigh 13.6 pounds on the Moon. Can't Type? press F11 or F5; Can’t Hear? Check: Speakers, Volume or Re-Enter Seminar Put ? in front of Questions so it is easier to see them.
Inverse Variation • When two quantities vary inversely, as one quantity increases, the other quantity decreases, and vice versa. • If a variable y varies inversely with a variable, x, then where k is the constant of proportionality. Can't Type? press F11 or F5; Can’t Hear? Check: Speakers, Volume or Re-Enter Seminar Put ? in front of Questions so it is easier to see them.
The string on an musical instrument vibrates at a frequency that varies inversely with its length. So a longer string vibrates slower than a shorter string. If a 1.5 foot piano string vibrates at 187.5 cycles per second. What is the frequency of a 3 foot string? Example So the string will vibrate at a frequency of 93.72 cycles per second. Can't Type? press F11 or F5; Can’t Hear? Check: Speakers, Volume or Re-Enter Seminar Put ? in front of Questions so it is easier to see them.
Joint Variation • One quantity may vary directly as the product of two or more other quantities. • The general form of a joint variation, where y, varies directly as x and z, is y = kxz where k is the constant of proportionality. Can't Type? press F11 or F5; Can’t Hear? Check: Speakers, Volume or Re-Enter Seminar Put ? in front of Questions so it is easier to see them.
Example With Simple Interest, the interest will vary jointly with the principal & time. If $2500 is put into an account for 3 years and earns $262.50, how much will be earned in 7 years? I= rPtI= rPt 262.50 = r(2500)(3)I= (0.035)(2500)(7) 262.5/7500 = r I= 612.5 0.035 = r The amount of interest earned in 7 years is $612.5. Can't Type? press F11 or F5; Can’t Hear? Check: Speakers, Volume or Re-Enter Seminar Put ? in front of Questions so it is easier to see them.
Combined Variation, example The force needed to keep a car from skidding on a curve varies jointly with the weight of the car and the speed squared, and inversely with the radius of the curve. If 242 pounds of force would keep a 2000 pound car from skidding on a curve with a radius of 500 feet at 30 mph, what force would keep the same car from skidding on a curve with a radius of 750 feet going 50 mph? Can't Type? press F11 or F5; Can’t Hear? Check: Speakers, Volume or Re-Enter Seminar Put ? in front of Questions so it is easier to see them.
Find the constant of proportionality. k = 0.0672 Now find f. f = 448.1 pounds of force Continued; If f = 242when w = 2000, s = 30, and r = 500, find f when w= 2000, s = 50, and r = 750. Can't Type? press F11 or F5; Can’t Hear? Check: Speakers, Volume or Re-Enter Seminar Put ? in front of Questions so it is easier to see them.
Page 152 4.2 Linear Inequalities Can't Type? press F11 or F5; Can’t Hear? Check: Speakers, Volume or Re-Enter Seminar Put ? in front of Questions so it is easier to see them.
Symbols of Inequality • a < b means that a is less than b. • a ≤ b means that a is less than or equal to b. • a > b means that a is greater than b. • a ≥ b means that a is greater than or equal to b. • Find the solution to an inequality by adding, subtracting, multiplying or dividing both sides by the same number or expression. • Important! Change the direction of the inequality symbol when multiplying or dividing both sides of an inequality by a negative number. Can't Type? press F11 or F5; Can’t Hear? Check: Speakers, Volume or Re-Enter Seminar Put ? in front of Questions so it is easier to see them.
Example: Graphing • Graph the solution set of x ≤ 4, where x is a real number, on the number line. • The numbers less than or equal to 4 are all the points on the number line to the left of 4 and 4 itself. The bracket at 4 shows that 4 is included in the solution set. ] Can't Type? press F11 or F5; Can’t Hear? Check: Speakers, Volume or Re-Enter Seminar Put ? in front of Questions so it is easier to see them.
Example: Solve and graph the solution Solve 3x – 8 < 10 and graph the solution set. The solution set is all real numbers less than 6. ) Can't Type? press F11 or F5; Can’t Hear? Check: Speakers, Volume or Re-Enter Seminar Put ? in front of Questions so it is easier to see them.
Compound Inequality Graph the solution set of the inequality -4 < x ≤ 3 The solution set consists of all real numbers between -4 and 3, including the 3 but not the -4. ( ] Can't Type? press F11 or F5; Can’t Hear? Check: Speakers, Volume or Re-Enter Seminar Put ? in front of Questions so it is easier to see them.
Example A student must have an average (the mean) on five tests that is greater than or equal to 85% but less than 92% to receive a final grade of B. Jamal’s grade on the first four tests were 98%, 89%, 88%, and 93%. What range of grades on the fifth test will give him a B in the course? Can't Type? press F11 or F5; Can’t Hear? Check: Speakers, Volume or Re-Enter Seminar Put ? in front of Questions so it is easier to see them.
Continued: 85% but less than 92; first four tests were 98%, 89%, 88%, and 93%. Can't Type? press F11 or F5; Can’t Hear? Check: Speakers, Volume or Re-Enter Seminar Put ? in front of Questions so it is easier to see them.
Page 159 4.3 Graphing Linear Equations Can't Type? press F11 or F5; Can’t Hear? Check: Speakers, Volume or Re-Enter Seminar Put ? in front of Questions so it is easier to see them.
The horizontal line is called the x-axis. The vertical line is called the y-axis. The point of intersection is the origin. y-axis Quadrant I Quadrant II x-axis origin Quadrant III Quadrant IV Rectangular Coordinate System Can't Type? press F11 or F5; Can’t Hear? Check: Speakers, Volume or Re-Enter Seminar Put ? in front of Questions so it is easier to see them.
Each point in the xy-plane corresponds to a unique ordered pair (a, b). Plot the point (2, 4). Move 2 units right Move 4 units up Plotting Points 4 units 2 units Can't Type? press F11 or F5; Can’t Hear? Check: Speakers, Volume or Re-Enter Seminar Put ? in front of Questions so it is easier to see them.
Page 163 To Graph Equations by Plotting Points • Solve the equation for y. • Select at least three values for x and find their corresponding values of y. • Plot the points. • The points should be in a straight line. Draw a line through the set of points and place arrow tips at both ends of the line. Can't Type? press F11 or F5; Can’t Hear? Check: Speakers, Volume or Re-Enter Seminar Put ? in front of Questions so it is easier to see them.
Graph the equation y = 5x + 2 x y 0 2 -2/5 0 -1 -3 Graphing Linear Equations Can't Type? press F11 or F5; Can’t Hear? Check: Speakers, Volume or Re-Enter Seminar Put ? in front of Questions so it is easier to see them.
Graphing Using Intercepts • The x-intercept is found by letting y = 0 and solving for x. Example: y = -3x + 6 0 = -3x + 6 -6 = -3x 2 = x, so the x-intercept is (2, 0) • The y-intercept is found by letting x = 0 and solving for y. Example: y = -3x + 6 y = -3(0) + 6 y = 6, so the y-intercept is (0, 6) Can't Type? press F11 or F5; Can’t Hear? Check: Speakers, Volume or Re-Enter Seminar Put ? in front of Questions so it is easier to see them.
Find the x-intercept. 3x + 2y = 6 3x + 2(0) = 6 3x = 6 x = 2, the x-intercept is (2, 0) Find the y-intercept. 3x + 2y = 6 3(0) + 2y = 6 2y = 6 y = 3 , the y-intercept is (0, 3) Example: Graph 3x + 2y = 6 Can't Type? press F11 or F5; Can’t Hear? Check: Speakers, Volume or Re-Enter Seminar Put ? in front of Questions so it is easier to see them.
Page 164 Slope The ratio of the vertical change to the horizontal change for any two points on the line. Can't Type? press F11 or F5; Can’t Hear? Check: Speakers, Volume or Re-Enter Seminar Put ? in front of Questions so it is easier to see them.
Positive slope rises from left to right. Negative slope falls from left to right. The slope of a vertical line is undefined. The slope of a horizontal line is zero. zero positive negative undefined Types of Slope Can't Type? press F11 or F5; Can’t Hear? Check: Speakers, Volume or Re-Enter Seminar Put ? in front of Questions so it is easier to see them.
Example: Finding Slope Find the slope of the line through the points: (5, -3) and (-2, -3) Can't Type? press F11 or F5; Can’t Hear? Check: Speakers, Volume or Re-Enter Seminar Put ? in front of Questions so it is easier to see them.
The Slope-Intercept Form of a Line Slope-Intercept Form of the Equation of the Line y = mx + b where mis the slope of the line and (0, b) is the y-intercept of the line. Can't Type? press F11 or F5; Can’t Hear? Check: Speakers, Volume or Re-Enter Seminar Put ? in front of Questions so it is easier to see them.
Graphing Equations by Using the Slope and y-Intercept Page 166 • Solve the equation for y to place the equation in slope-intercept form. • Determine the slope and y-intercept from the equation. • Plot the y-intercept. • Obtain a second point using the slope. • Draw a straight line through the points. Can't Type? press F11 or F5; Can’t Hear? Check: Speakers, Volume or Re-Enter Seminar Put ? in front of Questions so it is easier to see them.
Graph 2x- 3y = 9. Write in slope-intercept form. The y-intercept is (0,-3) and the slope is 2/3. Example Can't Type? press F11 or F5; Can’t Hear? Check: Speakers, Volume or Re-Enter Seminar Put ? in front of Questions so it is easier to see them.
y = (2/3)x - 3 Plot a point at (0,-3) on the y-axis, then move up 2 units and to the right 3 units. Example continued Can't Type? press F11 or F5; Can’t Hear? Check: Speakers, Volume or Re-Enter Seminar Put ? in front of Questions so it is easier to see them.
Graph y = -3. y is always equal to -3, the value of y can never be 0. The graph is parallel to the x-axis. Horizontal Lines Can't Type? press F11 or F5; Can’t Hear? Check: Speakers, Volume or Re-Enter Seminar Put ? in front of Questions so it is easier to see them.
Graph x = -3. x always equals -3, the value of x can never be 0. The graph is parallel to the y-axis. Vertical Lines Can't Type? press F11 or F5; Can’t Hear? Check: Speakers, Volume or Re-Enter Seminar Put ? in front of Questions so it is easier to see them.