Download
1 / 17
170 likes | 268 Views
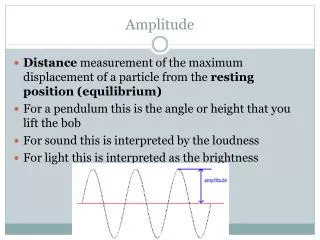
Wide Band Power and Harmonic Amplitude of Precipitation. Alex Ruane John Roads Scripps Institution of Oceanography / UCSD Ramat Gan, Israel: July, 2006. This work supported by NOAA and NASA. Overview. Introduction and Background Datasets and Methodology General Wide Band Behavior

E N D
Wide Band Power and Harmonic Amplitude of Precipitation Alex Ruane John Roads Scripps Institution of Oceanography / UCSD Ramat Gan, Israel: July, 2006 This work supported by NOAA and NASA
Overview • Introduction and Background • Datasets and Methodology • General Wide Band Behavior • Discussion
Motivation for Diurnal Examination • Currently, atmospheric parameterizations in global reanalyses tend to focus on longer-term means at the expense of extreme events • Too many small storms, not enough floods or droughts • AGCMs are not producing proper statistical distributions of sub-seasonal events • Goal is to simulate proper evolution, exchanges, and statistics of water and energy cycles throughout the day over diverse regions at multiple spatial and temporal scales • What are the frequency characteristics of reanalysis output? … of satellite products? • Are the limitations in parameterization or dynamics? • How are biases passed throughout the water and energy cycles?
Data Sets • Satellite Precipitation Products TRMM 3B42 ±50 N/S, 3-hourly values covering 200107 - 200412 CMORPH ±60 N/S, 3-hourly values covering 200301 - 200512 • GSM-based Global Reanalyses • T62L28, 3-hourly output, initialized 4x daily • Covering 200107 – 200412 • Weekly variation in SST PERSIANN ±50 N/S, 6-hourly values covering 200107 - 200412 NCEP / DOE Reanalysis-2 ECPC SFM Reanalysis
Methodology • Fourier-based Wide Bands • Filled in missing points with a cubic spline interpolation • Performed Fast Fourier Transform on 3-hr time series • Averaged frequency bands into several wide bands • Low-Frequency: Periods longer than 30 days • Synoptic: Periods between 2 days and 30 days • High-Frequency: Periods shorter than 2 days • Harmonic Reconstruction Analysis • Fit diurnal and semidiurnal harmonics to 3.5 years of precipitation at 3-hr resolution • No filling required Summertime Precipitation Example
Downward SW Radiation Flux from SFM Low-Freq Synoptic High-Freq Harmonic
Prior Expectations • General theory for precipitation would predict: • Low-frequency power in ITCZ and at high-latitudes • Synoptic power over mid-latitude storm tracks • High-frequency power in ITCZ and over land • Especially arid regions • Strong diurnal and semidiurnal harmonics over: • Coastlines • Mountains • ITCZ • Diurnal harmonic often described as explaining high percentage of variance over land areas
TRMM Behavior Low-Freq Synoptic High-Freq Harmonic
CMORPH Behavior Low-Freq Synoptic High-Freq Harmonic
PERSIANN Behavior Low-Freq Synoptic High-Freq Harmonic
SFM Behavior Low-Freq Synoptic High-Freq Harmonic
RII Behavior Low-Freq Synoptic High-Freq Harmonic
CMORPH TRMM SFM PERSIANN RII Zonal Mean Land/Sea Variance Explained
Discussion (1) • General Frequency Characteristics • Low-frequency power is very weak for precipitation • Likely due to unchanging baseline value of non-precipitating events • High-frequency variability dominates most locations • Likely due to short-lived convective events • Land has more power in high-frequency than ocean • Particularly over arid regions • Oceans have more synoptic power than land • Particularly over sinking portion of Hadley Cell • General Harmonic Characteristics • Extremely low variance described • Likely due to sporadic nature of precipitation • Most variance explained over mountainous regions and regions where there were no strong events
Discussion (2) • Both approaches are enlightening • Fourier approach • Full frequency characteristics • Relies on interpolation of missing values • Strongly affected by temporal averaging • Harmonic approach • Can be used on irregularly observed data • Performs very well when applied to strongly averaged series • May be restricted to physically understood variations • Differences • Fourier approach brings out much more of the expected high-frequency variation • Characteristic precipitation behaviors may be more readily identified using Fourier approach
Discussion (3) • Large biases evident in frequency characteristics • Among satellite products • TRMM appears to over-emphasize high-frequency variations • CMORPH appears to behave the most like our expectations, but is overwhelmed by particularly strong events • PERSIANN has the whitest spectrum • Among GSM reanalyses • SFM has spuriously large low-frequency and synoptic power over tropical oceans • RII has a spectrum that looks much more like we expected
Future Work • Apply these approaches to each component of the water and energy cycle • Run long-term experiments to test the sensitivity of these components’ frequency characteristics to: • Land-surface schemes • Cloud schemes • Convective schemes