Download
1 / 9
90 likes | 196 Views
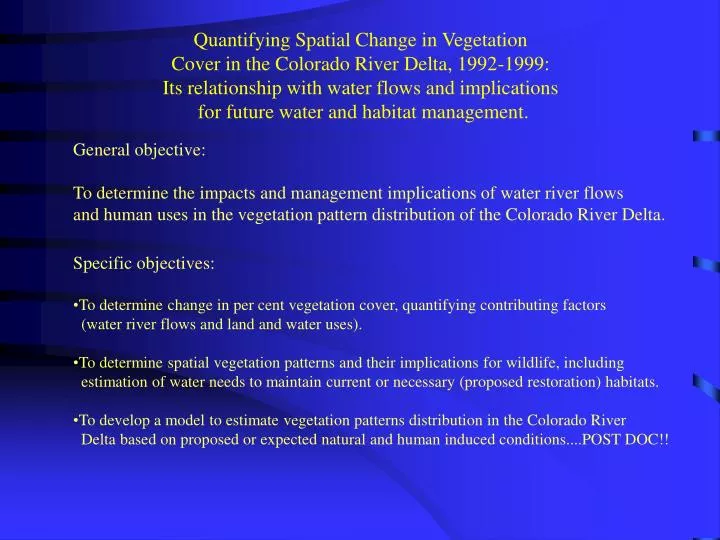
Quantifying Spatial Change in Vegetation Cover in the Colorado River Delta, 1992-1999: Its relationship with water flows and implications for future water and habitat management. General objective: To determine the impacts and management implications of water river flows

E N D
Quantifying Spatial Change in Vegetation Cover in the Colorado River Delta, 1992-1999: Its relationship with water flows and implications for future water and habitat management. General objective: To determine the impacts and management implications of water river flows and human uses in the vegetation pattern distribution of the Colorado River Delta. • Specific objectives: • To determine change in per cent vegetation cover, quantifying contributing factors • (water river flows and land and water uses). • To determine spatial vegetation patterns and their implications for wildlife, including • estimation of water needs to maintain current or necessary (proposed restoration) habitats. • To develop a model to estimate vegetation patterns distribution in the Colorado River • Delta based on proposed or expected natural and human induced conditions....POST DOC!!
Management Implications and Recommendations Remote Sensing and Field Work % Veg. Cover Map Change Analysis 1992-1999 INPUTS: water flows, land use, ground water, salinity, other Simulation Model
Analysis of % Vegetation Cover Based on Thematic Mapper (TM) Images: 1992 (May) 1993 (June) 1994 (July) 1996 (June) 1997 (February and July) 1998 (June) 1999 (May) Methods: Using Scaled NDVI method by Carlson and Ripley (1997) and the equation: % Veg. Cover = 74 NDVIscaled + 18.2 from Dycam and TM NDVI validation.
1996 Previous 2 years were relatively dry (less than 500 million cubic meters). 1999 Previous 2 years with relatively large water flows (3500 million cubic meters)
1996 1999
Impact of water flows Flooded area due to water flows June 1993 15,000 Million cubic meters February 1997 100 cubic meters/sec in same month