Download
1 / 19
200 likes | 404 Views
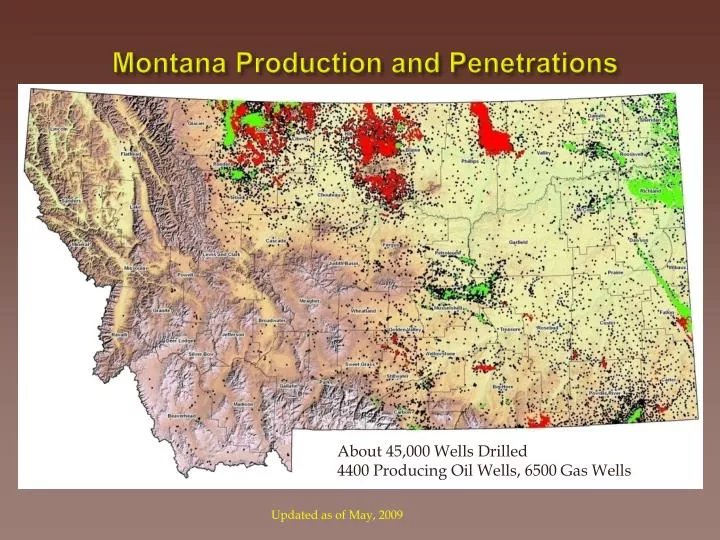
Montana Production and Penetrations. About 45,000 Wells Drilled 4400 Producing Oil Wells, 6500 Gas Wells. Updated as of May, 2009. MSU-Billings Economic Study Points. $9 BILLION: Total economic impact 12,000 TOTAL JOBS 4,500: Direct jobs 7,500: Indirectly supported jobs

E N D
Montana Production and Penetrations About 45,000 Wells Drilled 4400 Producing Oil Wells, 6500 Gas Wells Updated as of May, 2009
MSU-Billings Economic Study Points $9 BILLION: Total economic impact 12,000 TOTAL JOBS 4,500: Direct jobs 7,500: Indirectly supported jobs Economic impact of an additional 1 million barrels of oil produced 86 Full time positions $18.5 million in labor income A 10% increase in drilling activity could lead to 315 additional jobs. Industry Economic Impacts 2009 • 4,600 Employees in Exploration, Production, or Refining • Average Annual Refining Wage: $91,000 • $1.7 Billion Upstream, $8.2 Billion Refining • 0.7% of MT’s Jobs • Three-Times MT’s Average Annual Wage (with Benefits) • One-Eighth of MT’s Total Value Added
Oil and Natural Gas Production Tax Revenue Collections Total State Share: $754,490,290 Total Local Share: $730,403,908 TOTAL $1,484,894,198
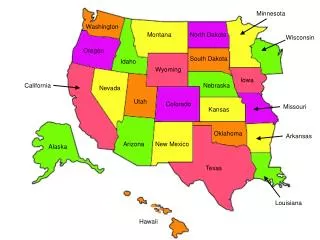
State Acres Leased & Producing Federal Leasing Activity In Montana
Alberta changes royalty structure: Decline in land sales, capital investments and production is result • In 2007, the provincial government increases royalties • Alberta “New Royalty Framework” results in decrease in O&G capital investment, new well completions, and mineral production • Changes include: • Increases maximum royalty rate for production • Oil – 43 percent increase • Gas – 67 percent increase • Eliminates “grandfathering” existing wells under new rules • Goal is net increase in royalty revenues of 20 percent • Net exploration and development investment in Alberta declines 40 percent • Exploration and development investment in British Columbia and Saskatchewan increase 2x • Decline seen in value of land at AB auctions; meanwhile, BC and SK auctions see sharp increase in land values
Royalty increase shifts CapExin Western Canada Royalty Changes Announced Before After +101% -36% -6% +19% Land auction values decline: Alberta vs. BC and Sask Panel Appointed and Changes Announced +100% +93% +136% +59% +22% -31% Source: Canadian Association of Petroleum Producers, 2009 Statistical Handbook
Recognizing the error, Alberta revises royalty policy; sees investments return • “The government has totally misunderstood the entire industry and how it operates…” -Matthew Johnston, the Western Standard • March 2010: after lengthy review of New Royalty Framework, Alberta government announces several changes intended to “energize investment”: • Maximum royalties reduced: 20 percent on oil; 39 percent on gas • Decrease in front-end royalties on conventional O&G wells • July 2010: the result is largest land sale in Alberta in five years with a value of $451 million (Cdn) • Alberta now seeing an increase in oil and gas investment and is beginning to recover revenues lost under previous royalty program
Refinery Production 8.2 Million Gallons of Products per Day 40% Distributed in Montana 60% Exported to 7 Other States Value of Oil and Gas Extracted $1.9 Billion Fuels Production • Value of Refined Products Produced $7.3 Billion • 50% of the total Manufacturing Production • 10% of the total Industrial Production
2010 Legislators’ Briefing Tour Sponsors Bitter Creek Pipelines, LLC ConocoPhillips Crowley Fleck PLLP Denbury Resources, Inc. Devon Energy Company DLD Enterprises Enerplus Resources (USA) Corp. ExxonMobil Fidelity Exploration & Production Co. Jefferson Energy Trading, LLC NFR Energy LLC Omimex Canada Ltd. Quicksilver Resources SM Energy Company Williston Basin Interstate Pipeline Co. XTO Energy Zone Exploration