Download
1 / 12
120 likes | 241 Views
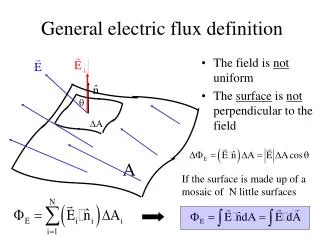
Interannual variability across sites: Bridging the gap between flux towers and flasks. Goals Obtain a mechanistic understanding of tower-scale interannual variability in NEE of CO 2 across many AmeriFlux/Fluxnet sites.

E N D
Interannual variability across sites: Bridging the gap between flux towers and flasks Goals Obtain a mechanistic understanding of tower-scale interannual variability in NEE of CO2 across many AmeriFlux/Fluxnet sites. Link observations of interannual variability in tower fluxes with the global CO2 flask network. Understand the mechanisms that govern interannual changes in the atmospheric CO2 budget.
Progress • Seasonal anomalies in tower fluxes are coherent over large spatial scales and are linked to climate. • Seasonal anomalies in fluxes are reflected in [CO2] data at AmeriFlux towers and at the oceanic flask sites(?).
Spatial coherence of seasonal flux anomalies A similar pattern is seen at several flux towers in N. America and Europe. Three sites have high-quality [CO2] measurements + data at Fluxnet (NOBS, HF, WLEF). The spring 98 warm period and a later cloudy period appear at all 3 sites.
Detection of the spring 98 anomaly via oceanic flasks? 2 Alaskan flask sites have slightly higher [CO2] in the spring of 98. Mace Head, Ireland shows a depression of [CO2] in the spring of 98. Potential exists to link flux towers with seasonal inverse studies.
More progress • Net radiation and precipitation become more correlated with NEE as the time scale increases. “Dryness” parameter as an indicator or large-scale interannual variability in NEE of CO2?
Respiration and temperature Correlation between nighttime tower flux and air temperature is very high on daily, monthly and seasonal time scales. Correlation breaks down on interannual scales. Data from the Walker Branch tower, Baldocchi, Wilson et al.
Precipitation and NEE of CO2 Poorly correlated on monthly and seasonal time scales. Correlation increases at annual time scales. Walker Branch example.
Net radiation and NEE of CO2 Net radiation shows correlation with NEE of CO2 at monthly, seasonal and annual time scales. Walker Branch example.
Dryness parameter and annual NEE of CO2 Correlation exists between dryness ( = Rnet / precip) and annual NEE of CO2 at all sites tested (WBranch, NOBS, HF, WLEF). Sign of the correlation changes! Mechanisms are not obvious.
Research needed • Construct a continental [CO2] network. • Get more multi-year flux tower data sets into the AmeriFlux/Fluxnet data base. Add [CO2]. • Continued analysis as the data base grows. • Conduct the North American Carbon Project. Deliverables • Mechanistic understanding of the causes of fluctuations in the global CO2 budget.