Download
1 / 36
370 likes | 795 Views
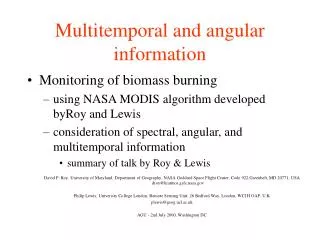
Interannual multitemporal applications of Landsat to forest ecosystem monitoring and management Randolph H. Wynne Department of Forestry Virginia Polytechnic Institute and State University wynne@vt.edu Key Co-Is & Collaborators Chris Potter & Rama Nemani, NASA Ames

E N D
Interannual multitemporalapplications of Landsat to forest ecosystem monitoring and management Randolph H. Wynne Department of Forestry Virginia Polytechnic Institute and State University wynne@vt.edu
Key Co-Is & Collaborators • Chris Potter & Rama Nemani, NASA Ames • Christine Blinn, Valquiria Quirino, Susmita Sen, Jess Walker, Tom Fox, Carl Zipper, & John Seiler, Virginia Tech • Feng Gao & Jeff Masek, NASA Goddard • Sam Goward, UMD • Jason Moan, NC Division of Forestry • Buck Kline, VA Department of Forestry • Jim Ellenwood, USDA Forest Service
Overall Objective • R&D in support of increased utilization of Landsat data for forest science and management, with particular focus on US Southeast, including forest industry
Key Themes • Explicitly multitemporal • Ties with rest of LDCM team • Collaborators across agencies & organizations (coops, NGOs) • Applied orientation
Update Summary • IGSCR in support of USDA Forest Service FIA Phase I in areas of rapid change (mid-NLCD cycle, indiv. scenes or mid-decadal) • Imagine automation complete (Musy et al. 2006; ASPRS Leica paper award) • Shared memory parallelization complete and publicly available (Phillips et al. 2007, 2008) • Parlaying this success into NASA AISR proposal • REDD pilot on 20,000 ha in SA • DSM pilots in Mojave and WV underway
DSM Involvement(Blinn) • Landsat & ASTER mosaics • Band ratio development (TM, ASTER, other) • Regression tree modeling • Model design and development • Spatial statistics • Temperature modeling
Remote Sensing for Forest Carbon Management • Landsat downscaling prototyped using STARFM for three scenes; pine age class evaluation of algorithmic performance • Downscaled product being used for reducing variance in FS models • Regionwide CO2 efflux and LAI acquired at network of monospecific sites with alternative forest management strategies • Assessment of VI’s empirical relationship with LAI and stand growth within and across years • Interface with Ames LAI/fPAR team • CASA modeling with Landsat
Decision Support for Forest Carbon Management: From Research to Operations • MODELS • ESE • NASA-CASA GYC • PTAEDA 3.1 • FASTLOB USDA Forest Service • FORCARB • DECISION SUPPORT: • Current DSTs • COLE (county-scale) • LobDST (stand-scale) • Growth and yield • Product output • Financial evaluations • CQUEST (1 km pixels) • Ecosystem carbon pools (g C/m2) • Partitioned NPP • (g C/m2/yr) • NEP (g C/m2/yr) • Linked DSTs and Common Prediction Framework • (multiscale) • Growth • Yield • Product output • Ecosystem carbon pools • Partitioned NPP • NEP • Total C sequestration • Forecasts and scenarios • VALUE & BENEFITS • Improve the rate of C sequestration in managed forests • Decrease the cost of forest carbon monitoring and management • Potentially slow the rate of atmospheric CO2 increase • Enhance forest soil quality • Information Products, Predictions, and Data from NASA ESE • Missions: • MODAGAGG • MOD 12Q1 • MOD 13 • MOD 15A2 • ETM+ Level 1 WRS • AST L1B and 07 • ESE MISSIONS • Aqua • Terra • Landsat 7 • ASTER Analysis Projects • IGBP-GCTE • IGBP-LUCC • USDA-FS FIA • USDA-FS FHM Ancillary Data • SPOT • AVHRR NDVI • Forest inventory data • VEMAP climate data • SRTM topographic data Inputs Outputs Outcomes Impacts
LAI (Leaf Area Index): • stand stratification for inventory • identification of poor-performing stands for early harvest • identification of stands with high levels of competition LAI plus GE (Growth Efficiency) Provides ability to estimate stand-level response to silviculture: (fertilization, release, tillage) Growth = 3.9 tons Growth = 7.2 tons Growth = 5.1 tons
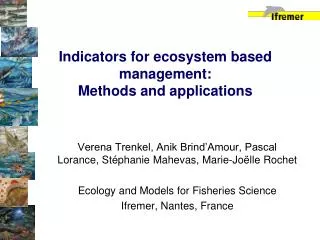
A Regionwide Evaluation of Vegetation Indices for the Prediction of Leaf Area Index in the Southeast
Study Area 17 path/row combinations
Fertilization Effect on LAI and VI Relationship 15 plots from 8 stands in three L5 images acquired either April 11 or May 2, 2006
STARFM NDVI Downscaling(Quirino, Gao) (a) (b) (c) Predicted Landsat Composites (left images) and Landat Images Used for Their Validation (right images): (a) Sample 1, (b) Sample 2, (c) Sample 3.
Retrospective Analysis of Growth and Yield (Blinn, Goward, Masek)
Retrospective Analysis cont... • Available Imagery: • 5 Landsat scene stacks were provided by the University of Maryland (UMD) courtesy of Sam Goward & Chengquan Huang • Each scene stack contained a time series of at least 12 images from 1984 through 2005 (at least 1 image every other year) • Scene stacks were already: • coregistered (aligned with each other) • converted to surface reflectance
Summary • Conversion of Landsat data to surface reflectance resulted in more scene to scene variation then TOA reflectance. • Thus far, it appears that the stands used to develop the LPG&Y Coop’s growth and yield models had relatively low leaf areas. • Caveat: The Flores LAI equation was not validated for use with earlier Landsat TM scenes. • Updated growth and yield models may be needed to accurately predict the outcomes of current silvicultural regimes.
Update Summary III(Moan, Ellenwood) • Forest Health • Southern Pine Beetle hazard rating pilot (Landsat + NC Statewide Lidar) • Slight improvement in Landsat-based host BA models (Cubist) when statewide lidar-derived DEM used • Also integrating forest age into hazard rating using DI for age classes deemed susceptible to SPB from CART/Cubist models
Update Summary IV • OSM Abandoned Minelands Reforestation Pilot (Sen, Zipper, Masek) • Focus on WV and western VA • Detection of previously mined areas (first phase) • Assessment of reclamation quality • Using explicit trajectory-based approach
Multitemporal approach-Rationale • Disturbance like mining has distinctive temporal progressions of spectral values • Temporal trend of vegetation recovery termed as “spectral trajectory” • Spectral trajectories function as a diagnostic of the change • Multitemporal trends are more stable than individual image pixel change reading (Kennedy et al, 2007). Fig.1 Ideal Spectral Trajectory of a reclaimed mined vegetation Y Vegetated Re-vegetated Clear-cutting Revegetation Index Value Mined 0 X Time
Oct. 2000 May 2002 Apr. 2000 Mar. 2000 Aug. 1988 June 2000 June 2003 June 1987 June 1988 Sept. 1994 Sept. 1998 Landsat scene dates
Search for the ideal index value: 1988, points not mined 1991, points already mined
Comparison of NDVI of mined and surrounding un-mined points Location of the mined and un-mined points on the False color image of 1998 • Points 64 and 67 are mined points • Points 25, 26, 27 and 28 are • un-mined points. Comparison of NDVI values of mined and un-mined points
Some other promising indices: Reduced Simple Ratio (RSR) and NDVI values for pt.64 TC2 (Greenness) values for pts. 64 and 67 Pt.64 NDVI and normalized NDVI values for pts.64 and 67 Pt. 64 NDMI and NDVI values for pt.64
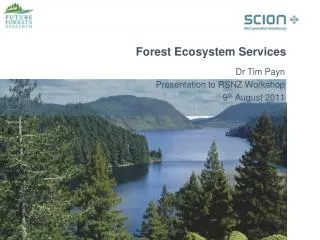
Update Summary V • MEASURES (Management-scale Ecological Assessment Using Remote Sensing; Potter, Kline, Blinn, Saleh, Walker) • Key features: web-delivery, RS (lidar, digital orthoimagery, Landsat), scale, validated numbers, real-time modeling • Foundation, state, and Forest Service support • Initially just C and water; biodiversity in development • Linkage with BSI and NGO Ecosystem Services model clearinghouse (TNC)
Conclusions Landsat-scale = management scale (almost perfect spatial resolution) Seasonal and interannual time series now pro forma (function, process) Importance of data set continuity (Why not 8-day revisit akin to Resource21) Synergism from working more as team Multitemporal in situ data sets greatly increase value of Landsat data
Thanks! Randolph H. Wynne