Download
1 / 28
280 likes | 433 Views
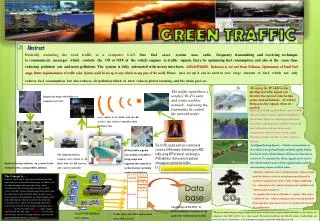
Green actions in the Air Traffic Management perspective. Tomas Mårtensson, Martin Hagström; FOI. Flygteknik 2010, 18-19 October. Outline – what will I talk about?. Overview on emissions from aviation Compositions and effects on climate

E N D
Green actions in the Air Traffic Management perspective Tomas Mårtensson, Martin Hagström; FOI Flygteknik 2010, 18-19 October
Outline – what will I talk about? Overview on emissions from aviation Compositions and effects on climate How much emissions are there from aviation (EU-perspective) What can Air Navigation Service (ANS) providers do? How to measure “green actions”, what is good and what is bad? Environmental Key Performance Indicators. The need for Trade-off studies. Conclusions Flygteknik 2010, 18-19 October
Emitted substances From: Lee, D.S., et al., Aviation and global climate change in the 21st century, Atmospheric Environment (2009), Flygteknik 2010, 18-19 October
Aviation emissions Aviation is an unique emission source. Release occur in the upper troposphere and lower stratosphere (8-12 km) on a global scale Flygteknik 2010, 18-19 October
Emitted substances From: Lee, D.S., et al., Aviation and global climate change in the 21st century, Atmospheric Environment (2009), Flygteknik 2010, 18-19 October
Aviation emissions in European airspace Source: EUROCONTROL Performance Review Report 2009 Flygteknik 2010, 18-19 October
Aviation fuel efficiency Airlines / Manufactures ANS Air Navigation Service Aircraft fuel efficiency Load factor ANS fuel efficiency Optimal vs actual trajekctory Flygteknik 2010, 18-19 October
Horizontal flight efficiency TMA = Terminal Manoeuvring Area GCD = Great Circle Distance DC = Direct Course A = Actual route TMA A DC TMA GCD
Horizontal flight efficiency Actual route 922 km Direct Route extension 32,3 km En route Extension +47.6 km Direct Course 890 km TMA Interface 15,3 km Great Circle 874 km Source: EUROCONTROL Performance Review Report 2009 Flygteknik 2010, 18-19 October
Inefficiencies actionable by ANS Source: EUROCONTROL Performance Review Report 2009 Green actions from ANS acts on all aircrafts Flygteknik 2010, 18-19 October
ANS ways of reducing emissions Airspace design Free route air spacing (FRAS) Arrival and Departure route design (STAR/SID) Use of Precision Navigation procedures Arrival and departure manager (AMAN/DMAN) Continuous Descend Operations Better use of weather information Optimum use of Runways Timing and punctuality Flygteknik 2010, 18-19 October
What are the problems? The European borders… Trade-off considerations Safety versus Nothing Capacity versus Environment Emissions versus Noise How to measure what actual benefits there is from “green” actions taken in ATM? Flygteknik 2010, 18-19 October
How to measure potential benefits from operational procedure changes? FOI worked with LFV ANS to develop environmental Key Performance Indicators (KPI) 2009-2010. Build the KPI:s from available systems. The limitations with data from available systems are: Swedish airspace, Phase of flight, not all airports, Spatial resolution, time resolution, formats, metadata The recommendation was to use radar-tracks archived in Noise monitoring system. Covers the ten largest airports in Sweden out to 50 nm with high resolution in space and time for all flights. Flygteknik 2010, 18-19 October
Suggested environmental KPIs Flown distance [nm] Excessive lateral flown distance [nm] Fuel consumption [kg] Additional fuel consumption [kg] Number of CDA. Time in levelled flight [minutes] [%] Taxi time [minutes] *all defined as an average per flight FOI project team with LFV: Benny Jansson, Tomas Mårtensson, Björn Nevhage, Maria Stenström Flygteknik 2010, 18-19 October
Flown distance DARR = True flown distance of arriving flights [nm] DDEP = True flown distance of departing flights [nm] narr = number of landings ndep = number of take-off Flygteknik 2010, 18-19 October
The sum of flown distance over a day Sum of flown distance in TMA Time of day 00 06 12 18 24 Flygteknik 2010, 18-19 October
Excessive lateral flown distance darr ddep d = norm [nm] Flygteknik 2010, 18-19 October
How to chose a normative distance in real life operations ? ARLANDA Take Off RWY 08 Landing RWY 01L (Figure from LFV) Flygteknik 2010, 18-19 October
Time in levelled flight 1 2 3 4 5 6 Six flights to Arlanda from distance 50 nm until touch down at RWY 26 Trade-off: Noise - Emissions (Data from LFV/(Swedavia, ANOMS system) Flygteknik 2010, 18-19 October
Emissions versus Noise Runway Flygteknik 2010, 18-19 October
Lowest emissions = Direct Course RWY Flygteknik 2010, 18-19 October
Lowest Noise RWY Flygteknik 2010, 18-19 October
Real operations RWY Flygteknik 2010, 18-19 October
Emissions versus Noise Tomorrow = y movements/day CO2 Cap “Tomorrow Noise legislation Release of CO2 /day Today = x movements/day “Today” Minimum CO2 Noise Impact /day Minimum Noise FOI. Clausen Mork et al. Flygteknik 2010, 18-19 October
Conclusions Last year, ~44 Million tones of kerosene was burned within in EUROCONTROL Area (excl sport & military aviation). ANS can act on ~6 % of aviation emissions (more for individual flights) There is a need for better measures (KPI:s) with high resolution in time and space to be able to quantify “green actions” Suggested Key Performance Indicators Flown distance, Excessive Lateral flown distance, Fuel burn, Excessive fuel burn, Number of CDA:s, Time in levelled flight and Taxi time. As aviation grows, there is a clear need to put numbers on the trade-off between noise and emissions to meet future legislations. Flygteknik 2010, 18-19 October
Thank you for your attention! FOI ̶ research for a safer world Flygteknik 2010, 18-19 October