Download
1 / 74
740 likes | 746 Views
T-test with equal variance and unequal variance Paired t-test The t-test in Java Does a dataset meet the parametric assumptions? Non-parametric equivalents to the t-test. The algebra of linear regressions. Two forms of the t-test. This is a weighted average.

E N D
T-test with equal variance and unequal variance Paired t-test The t-test in Java Does a dataset meet the parametric assumptions? Non-parametric equivalents to the t-test. The algebra of linear regressions
Two forms of the t-test This is a weighted average Here the “biggest” variance wins
The t-test breaks if you mess with the assumption of equal variance
Should we always just use the t-test with the assumption of unequal variance? The answer seems to be “yes”. There is no sensitivity penalty for dropping the assumption of equal variances…
This is probably why R sets var.equal=false as the default. There is no reason not to use it…
Because the math is easier to understand (or maybe just because people don’t know any better, the assumption of equal variance is often left in…)
This conclusion is consistent with the mini-experiment we just did in R!
T-test with equal variance and unequal variance Paired t-test The t-test in Java Does a dataset meet the parametric assumptions? Non-parametric equivalents to the t-test. The algebra of linear regressions
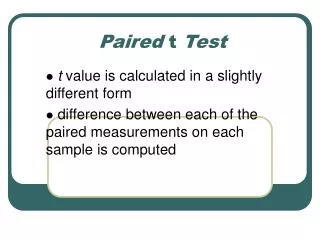
You can tell R whether the t-test is paired or un-paired Uo is usually zero http://en.wikipedia.org/wiki/Student%27s_t-test#Dependent_t-test_for_paired_samples
T-test with equal variance and unequal variance Paired t-test The t-test in Java Does a dataset meet the parametric assumptions? Non-parametric equivalents to the t-test. The algebra of linear regressions
http://bigscience.uncc.edu/fodorstatistics2013/statFunctions.zip/viewhttp://bigscience.uncc.edu/fodorstatistics2013/statFunctions.zip/view
or this… which are both trivial… (likely this is all easy to do in Python as well…)
T-test with equal variance and unequal variance Paired t-test The t-test in Java Does a dataset meet the parametric assumptions? Non-parametric equivalents to the t-test. The algebra of linear regressions
Assumptions of the t-test: Independence Normality Equal Variance ( or not ) How can we evaluate these assumptions? We must meet the assumption of independence, because our test statistic is built from an independent sum of the square of independent, normal variables. But the numerator and denominator are built on an assumption of normality. We can relax the assumption of equal variance, but not the other two or our calculations of p-values don’t have much meaning…
R has lots and lots of way to see if a distribution is normal…. Scales the y-axis in probability space Show the raw data on the histogram Obviously this is not normal… (An introduction to R; section 8.3)
We can, of course, use qqnorm to visually test for normality…
What about just the long eruptions? Not too far off… We would like a statistical test that tells us if this is normal or not… We could use the chi-square test…
Or, alternatively, ?ks.test
From the numerical recipes book… We are going to have to take their word for this! (i.e. we won’t prove this works)
We reject a null hypothesis that the second eruption data is non-normal Albeit with some warnings (that we will ignore for now)
T-test with equal variance and unequal variance Paired t-test The t-test in Java Does a dataset meet the parametric assumptions? Non-parametric equivalents to the t-test. The algebra of linear regressions
What can you do when you don’t have a normal distribution (or you don’t know?) You can transform log(x), sqrt(x), cubeRoot(x), etc. etc. Alternatively, you can use a non-parametric test…. Replace every value by its rank…
Some made up data: The weight of three blue whales (kg) : 108000, 104000, 102000 The weight of three mice (kg): 0.0001, 0.0002, 0.0003 Null hypothesis: the weight of blue whales is the same at the weigh of mice except for sampling error… To use a t-test: But this p-value is subject to the assumption of normality..
The Wilcoxon test. Replace each value by its rank. Replacing an unknown distribution with a known one. We ask.. What are the odds that we would see a separation of ranks as good as the separation we did see.. The weight of three blue whales (kg) : 108000, 104000, 102000 The weight of three mice: 0.0001, 0.0002, 0.0003 Becomes…. The weight of three blue whales (kg) : 1,2,3 The weight of three mice: 4,5,6 We know (6,3) = 20. We could choose 1,2,3 (with a prob. of 0.05) or 4,5,6 (with a prob. of 0.05). Our p-value for the two-sided test is therefore .1 (or the one-sided test is 0.05)
Advantage of Wilcoxon test: No parametric assumptions! Disadvantage: Low power for small sample sizes… Often in genomics, we don’t have a big enough sample size to take full advantage of the non-parametric tests..
T-test with equal variance and unequal variance Paired t-test The t-test in Java Does a dataset meet the parametric assumptions? Non-parametric equivalents to the t-test. The algebra of linear regressions
Linearity Independence Normality Equal Variance Neter et al - Applied Linear Statistical Models
This is the example from the 3rd edition of “Applied Linear Statistical Models” (3rd edition) X <- c(30,20,60,80,40,50,60,30,70,60) Y <- c(73,50,128,170,87,108,135,69,148,132) plot(X,Y)
R has an extremely simple syntax for linear regression > X <- c(30,20,60,80,40,50,60,30,70,60) > Y <- c(73,50,128,170,87,108,135,69,148,132) > myLinearModel = lm( Y ~ X ) The kinds of models are summarized on p. 50-1 in “An introduction to R”
> X <- c(30,20,60,80,40,50,60,30,70,60) > Y <- c(73,50,128,170,87,108,135,69,148,132) > myLinearModel = lm( Y ~ X ) Hiding in that Y ~ X is an intercept and an error term The full model is: Yi and Xi are the i th observation B0 and B1 are parameters ei is the error-term or i th residual We seek parameters B0 and B1 that minimize the sum-squares of the error terms.
Neter et al - Applied Linear Statistical Models Linearity Independence Normality Equal Variance s2 is the variance of the error terms
The actual value The error The expected value under the model Assumption: The error terms are normally distributed with a constant variance ( s2 ) independent of the x-value Neter et al - Applied Linear Statistical Models