Download
1 / 24
240 likes | 361 Views
Multiple Tonotopic Areas in Human Auditory Cortex as Revealed by fMRI. Thomas M. Talavage. Massachusetts General Hospital NMR Center Massachusetts Institute of Technology, Division of Health Sciences and Technology, Speech and Hearing Sciences Program. Acknowledgments. Jennifer R. Melcher

E N D
Multiple Tonotopic Areas in Human Auditory Cortex as Revealed by fMRI Thomas M. Talavage Massachusetts General Hospital NMR Center Massachusetts Institute of Technology, Division of Health Sciences and Technology, Speech and Hearing Sciences Program
Acknowledgments Jennifer R. Melcher Randall R. Benson Patrick J. Ledden Martin I. Sereno Anders M. Dale Michael E. Ravicz Bruce R. Rosen NSF Graduate Fellowship Speech and Hearing Sciences NIH Training Grant
How to examine tonotopy with fMRI? • Demonstrate frequency selectivity in human auditory cortex • Demonstrate continuity of frequency selectivity • Find progressions of frequency selectivity over surface of cortex • Find “ends” of progressions of frequency selectivity • Verify that results are consistent
Imaging Auditory Cortex • Specially designed temporal lobe surface coil (built by P.J. Ledden)
Demonstrating Frequency Selectivity • Discrete Stimulation Paradigm • Alternate Lower- and Higher-frequency stimuli • Lower-frequency: f < 650 Hz • Higher-frequency: f > 2500 Hz • Find responses which are time-locked to the paradigm • Higher signal level during presentation of one stimulus (t-statistic) implies preference (selectivity)
A B A B Predicted Low CF Response Predicted High CF Response Discrete Stimulation Paradigm Stimulus Frequency Spectrum Time
Lower-frequency LoHG (20-100 Hz) (7-8 kHz) HiHGPL HiHGM Higher-frequency Selectivity on Heschl’s Gyrus Subject 1 Instrumental Music Stimulus MGH-NMR Center Thomas M. Talavage
Superior High Frequency Response Area Lateral Not imaged Low Frequency Response Area ( ) Heschl’s Gyrus Selectivity on Heschl’s Gyrus Subject 2 Subject 1 Music Music Subject 3 Subject 4 Tone Bursts Music
Anterior Right Left Posterior Inferior Superior Selectivity in Supratemporal Plane Subject 5 - AM Filtered Noise Heschl’s Gyrus Orange - Yellow: Higher-frequency selective response areas Blue - Green: Lower-frequency selective response areas Activity significant to the p < 0.01 level (t-statistic)
Anterior Lower-frequency response area Higher-frequency response area Lateral Frequency Selectivity Summary LoSTA HiHGL LoHGL HiHGM LoSTP LoHG HiHGP HiHGPL Supratemporal Plane
Demonstrating Continuity • Continuous Stimulation Paradigm • Repeated presentation of a time-varying stimulus • Find responses which are time-locked to stimulus • Determine point within stimulus to which the response is time-locked (relative phase) • Plot the relative phase on cortex • Look for continuous variations of relative phase over the surface of cortex
Down Sweep Higher Frequencies 8000 0.3 octaves Freq (Hz) Lower Frequencies 125 0 64 Time (sec) Continuous Stimulation Paradigm • Stimulus • Band-limited noise, center frequency swept Down or Up • One-to-one mapping of center frequency to time within sweep • Presentation • 35 dB re behavioral threshold • Monaural, contralateral to surface coil (largest response)
Cortical Inflation Technique from Dale and Sereno (1993) White Matter Surface Light gray - tops of gyri Dark gray - bottoms of sulci Inflated White Matter Surface
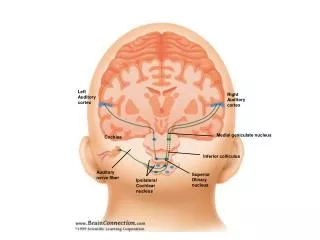
Inflated Auditory Cortex Superior Heschl’s Gyrus Planum Temporale Anterior Posterior STG STS Inferior
Higher-frequency selective response area (Earlier phase) H L L H H H L L L Lower-frequency selective response area (Later phase) Continuous Results: Down Sweep 961110: Subject 1 8 Down Sweep Runs
Higher-frequency selective response area (Later phase) H L L H H H L L L Lower-frequency selective response area (Earlier phase) Continuous Results: Up Sweep 961019: Subject 1 8 Up Sweep Runs
Higher-frequency selective response area (Earlier phase) L H L L H H L L L H L Lower-frequency selective response area (Later phase) Continuous Results: Down Sweep 961027: Subject 2 8 Down Sweep Runs
L H L L H H L L L H L Lower-frequency selective response area (Earlier phase) Continuous Results: Up Sweep Higher-frequency selective response area (Later phase) 961124: Subject 2 7 Up Sweep Runs
L Region of Higher-frequency selectivity Region of Lower-frequency selectivity L H Results: Subject 1 Summary Heschl’s Gyrus H L L H H H STG STS L L
H L H H L Region of Higher-frequency selectivity Region of Lower-frequency selectivity L H Results: Subject 2 Summary Heschl’s Gyrus L L L STG L STS H L
Inflated Auditory Cortex L H H L L L L H L H L H H Top of Heschl’s Gyrus L L L L - Lower-frequency response area H - Higher-frequency response area H L L H L H L Consistency of Results 960316 - Higher- vs. Lower-ƒ L 961110 - Up Sweep
Contralateral (Left) Ipsilateral (Right) H H L L L L H H H H H H L L L L L L Interhemispheric Consistency 970305 - Down Sweep (8 runs)
Conclusions • Organization of maps on Heschl’s gyrus is similar across subjects • Lower-frequency selectivity on body of Heschl’s gyrus • Higher-frequency selectivity “surrounding” Heschl’s • Maps are organized in mirrored fashion • Human auditory cortex possesses multiple tonotopic maps (4+) on Heschl’s gyrus
Future Work • Apply knowledge of frequency organization to study of frequency-specific hearing loss • e.g. Presbycusis (How do maps change?) • Establish homologies of auditory fields with animals to permit study of higher processing • e.g. Language comprehension • Potential as a diagnostic tool?