Download
1 / 41
410 likes | 517 Views
Ecological Sites and their Relationship to Soil Mapping. Steve Campbell Soil Scientist USDA – Natural Resources Conservation Service West National Technology Support Center Portland, Oregon. From the National Range and Pasture Handbook: .

E N D
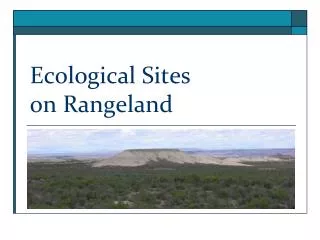
Ecological Sites and their Relationship to Soil Mapping Steve Campbell Soil Scientist USDA – Natural Resources Conservation Service West National Technology Support Center Portland, Oregon
From the National Range and Pasture Handbook: • Ecological sites have characteristic soils that have developed over time throughout the soil development process • Soils with like properties that produce and support a characteristic native plant community are grouped into the same ecological site.
From the National Soil Survey Handbook: • Soil-ecological site correlation establishes the relationship between soil map unit components and ecological sites. • Ecological sites are correlated on the basis of soils and the resulting differences in species composition, proportion of species, and total production of the historic climax plant community.
Soil map unit on a mound – intermound landform Depths in inches
Ecological Site Description Information Sources • Web Soil Survey • Ecological Site Information System (ESIS)
Click on the “Start WSS” button to get started. websoilsurvey.nrcs.usda.gov
The first step is to create your “Area of Interest (AOI)”. Current selection criteria include Address; County; Soil Survey Area; Lat/Long; Section, Township and Range; Federal Land category, and Hydrologic Unit.
A new option – you can import a shapefile or zipped shapefile to create an Area of Interest (AOI)
In this example “PLSS” is the navigation choice. Select the State. Enter Section, Township, Range. Click on the “View” button to zoom to this section.
We’re now zoomed in to Section 3, Township 19 S, Range 35 E. The State and County names are also displayed.
When you zoom in, the orthophoto, roads, and water features appear. Layers can be turned on and off by clicking on the “Legend” tab.
In this example, we want to include both Section 3 and 4 in our Area of Interest. We’ll use the Zoom Out tool to make both sections visible.
The “AOI” buttons are used to create your Area of Interest. The left button creates a rectangle. The right button creates a polygon of any shape. The user creates the shape by left clicking at each vertex. Left double click at the last vertex to create the Area of Interest.
After you draw your “Area of Interest”, it will appear as a blue hatched area.
After the “AOI” is created, the size of the area and the type of data that is available is displayed. The next step is to click on the “Soil Map” tab.
Soil Map with Legend of Map Units, Acres, and Percent of Area
Click on the “Soil Data Explorer” tab to create maps and reports of soil properties, interpretations, and ecological site information.
The Soil Data Explorer tab provides multiple options for displaying soils and ecological site information. The “Suitabilities and Limitations for Use” tab is used to create maps and reports of a single interpretation such as “Rangeland Seeding, Great Basin Ecoregion”. The “Ecological Site Assessment” tab is used to view and print sections of Ecological Site Descriptions. The “Soil Properties and Qualities” tab is used to create maps and reports for a single soil property such as Percent Clay in the surface horizon. The “Soil Reports” tab is used to view and print reports that contain multiple soil properties and interpretations.
TheEcological Site Assessmenttab can be used to generate maps of the dominant ecological sites and reports of ecological site descriptions.
TheEcological Site Assessmenttab report of Ecological Sites in the Area of Interest (AOI).
After selecting an ecological site, the following View Options are available: • Plant Community Photos • State Transition Diagram • Ecological Dynamics Description
Reference Plant Community Photo: R010XC032OR – SR MOUNTAIN 12 – 16 PZ
State Transition Diagram: Ecological Site R010XC032OR - SR MOUNTAIN 12 – 16 PZ
Ecological Dynamics Description R010XC032OR - SR MOUNTAIN 12 – 16 PZ
1. Select the “Reference Plant Community” option 2. Select the “View Options” 3. Click the “View Plant Community Info” button to generate a report.
Ecological Site Information System (ESIS)http://esis.sc.egov.usda.gov/
Click on the Approved ESD Reports link to access ecological site descriptions.
Queries for Ecological Site Descriptions (ESD’s) can be submitted by Major Land Resource Area (MLRA), State, or both
In this example we’ll query for ESD’s in MLRA 8 from Oregon. Click the Submit button after the query criteria are selected.
A list of ESD’s in MLRA 8 from Oregon are produced. Click on an ESD link to view the ecological site description.
Soil survey data in combination with other spatial data can be used as tools to help develop and correlate ecological sites. soildatamart.nrcs.usda.gov datagateway.nrcs.usda.gov
Map showing the extent of an ecological site created from soil survey tabular and spatial data.
Tabular reports of soil properties from soil survey databases
Questions ??? Steve Campbell Soil Scientist USDA – Natural Resources Conservation Service West National Technology Support Center Portland, Oregon Phone: 503-273-2421 E-mail: steve.campbell@por.usda.gov