Download
1 / 23
230 likes | 237 Views
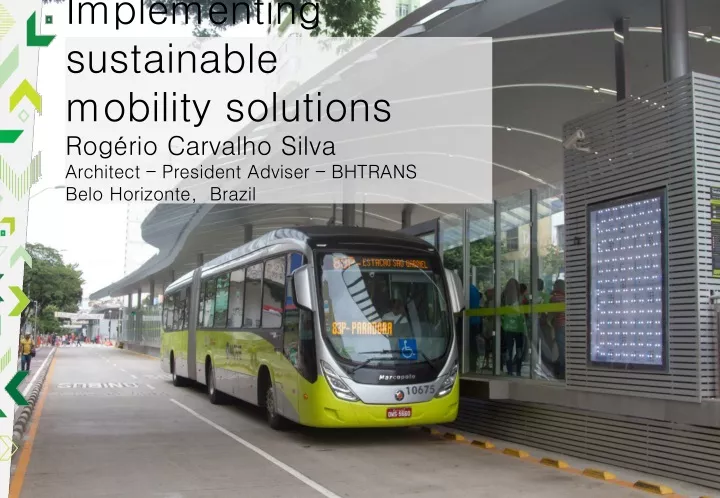
Implementing sustainable mobility solutions Rogério Carvalho Silva Architect – President Adviser – BHTRANS Belo Horizonte, Brazil. The City. Population of BH 2.4 million inhabitants Population of RMBH 5.7 million inhabitants 6.3 million trips a day 2.5 trips / inhabitants / day.

E N D
Implementing sustainable mobility solutions Rogério Carvalho Silva Architect – President Adviser – BHTRANSBelo Horizonte, Brazil
The City • Population of BH 2.4 million inhabitants • Population of RMBH 5.7 million inhabitants • 6.3 million trips a day • 2.5 trips / inhabitants / day
Transport System • Public transport by bus: 293 lines, 3 thousand buses, 1.8 million passangers/day • Metropolitan train: 28 km, 19 stations, 200 thousand passangers/day • City car fleet: 1.5 million cars – BH + 1 million - RMBH
City Strategic Planning Vision 2030 Belo Horizonte: city of opportunities, sustainable and with quality of life Ensure mobility and accessibility in the urban environment through integrated networks, transport demand management and quality of public transport services
(2013) Inventory of greenhouse gases emissions in BH Distribution by Sectors (in %) Fixed Units Urban Rejects Transport Sector The transportation sector is responsible for about 70% of the total CO2 emissions Goal: to reduce the greenhouse gases emissions by 20% until 2030
BH 2002/2012: increase in travels and larger participation of the individual modes* 2002: 2,7 millions of tpd 2012: 4,1 millions of tpd Buses Buses Cars Cars Motorcycles Motorcycles Bicycles Bicycles Others Others * excluding walking trips • The public transport had a strong loss over a decade, falling from a 57.6 % share in 2002 to 34.6% in 2012 • The participation of cars rose from about 1/3 to about 50%, being the most widely used modal in 2012
PlanMobBH – Starting PointUnsustainable Tendencies Average travel time in minutes Public Transport Automobiles Non Motorized General Average
Fundamental Objectives of PlanMobBH Reduce the Number of Fatalities in Traffic Increase the percentage of trips by foot (emphasis on trips up to 2km) Reduce the Increased Trend of Greenhouse Gases Emission Increase the percentage of bicycle trips (emphasis on trips up to 8km) Reduce the growth in the use of individual transportation (auto and motorcycle) Increase the current number of trips on public transport
The 4 pillars of the City Sustainable Urban Mobility Plan (PlanMobBH)
Structuring initiatives for sustainable urban mobility in BH TOD Projects Urban Operation ACLO Regional Plans: New Centralities
Structuring initiatives: MOVE, the BRT of Belo Horizonte 23 km of exclusive lanes with two-way traffic, 5 integration stations at the edges and 40 transfer station along the corridor, transporting about 500,000 pass./day Decrease in the number of bus trips in the morning peak hour Travel time reduction in the morning peak hour Number of passengers per business day
BRT – Bus Rapid Transitand Exclusive lanes for buses • Present status (2017) • 23 km BRT; • 12 km exclusive bus lanes; • 7 integration stations and 36 transference stations; • Forecast (2030) • 150 km BRT; • 54 km exclusive bus lanes • 11 integration stations.
Electric Bus (2018) • Test of electric buses with a self-sufficiency higher than 250 km (each charge) – 80% of an average urban bus route; • Performance evaluation. • Operational costs evaluation.
Stimulating non-motorized modes Build a walking network integrated with the public transport and urban projects that brings improvements for pedestrians
30km/h Zones • Reduction of car speed in order to guarantee the pedestrians and cyclists safety. • The red patterned areas indicate the selection of regions where the 30 zones will be implemented. Proposal for Downtown Area
Pedala BH – Bike routes project • Cycle infrastructure implementation plan: • (2020): 411 km • (2030): 1.000 km
Pedala BH – Bike routes project 40 bycicle sharing stations in downtown Belo Horizonte and near touristic spots.
Rational Use of Automobiles Incentive to transport alternatives Discouraging the use of private transport TOD Speed limit reduction Start Public Transportation Mitigation potential Management of parking areas Gradual intensification Bicycle Restriction of circulation areas Walking Triggers Trip distance Transportation demand management through coherence and integration of measures and modes of transport, resulting in a change of the predominant culture.
Expected Results Modal Split (2012-2030) Traffic Jam Costs – R$ Billions 2020 From 2021 to 2025 From 2026 to 2030 From 2020 to 2030 Trend Planned Net-gain Public: planned Public: trend Private: planned Private: trend Non-motorized: planned Non-motorized: trend
Obrigado pela atenção. Rogério Carvalho Silva rogecarv @pbh.gov.br www.bhtrans.pbh.gov.br Thank You Rogério Carvalho Silva rogecarv@pbh.gov.br www.bhtrans.pbh.gov.br
Municipal plan for greenhouse gases emissions reduction– PREGEE Emissions projection (millions tCO2e/year)
Evolution of some Mobility IndicatorsUnsustainable Tendencies
Structuring initiatives for sustainable urban mobility in BH Pedala BH: 80km of bike lanes + 40 shared bike stations MOVE: the BRT of BH 23 km + 12 kilometers of exclusive bus lanes 30 km/h zones: attempt to keep road traffic speed down to a safe level Less street parking areas and more quality space for pedestrians