1 / 32

Last Glacial Maximum: Ice Sheets, CO2, and Global Climate

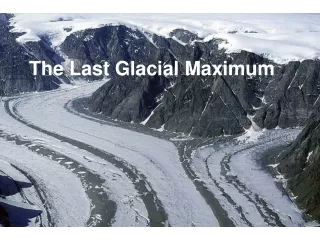
Explore the impact of large ice sheets and lower CO2 levels on global climate during the Last Glacial Maximum, 21,000 years ago. Discover the evidence from cave paintings, ocean temperature reconstructions, pollen distributions, and more. Understand how these factors influenced the ecosystems and landscapes of different regions.

cdellinger
Download Presentation

Last Glacial Maximum: Ice Sheets, CO2, and Global Climate

An Image/Link below is provided (as is) to download presentation Download Policy: Content on the Website is provided to you AS IS for your information and personal use and may not be sold / licensed / shared on other websites without getting consent from its author. Content is provided to you AS IS for your information and personal use only. Download presentation by click this link. While downloading, if for some reason you are not able to download a presentation, the publisher may have deleted the file from their server. During download, if you can't get a presentation, the file might be deleted by the publisher.

E N D

Presentation Transcript


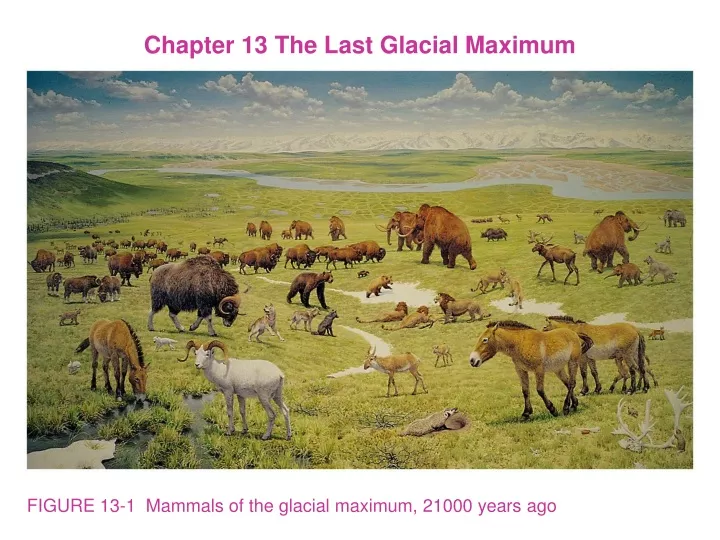
  1. Chapter 13 The Last Glacial Maximum FIGURE 13-1 Mammals of the glacial maximum, 21000 years ago

  2. FIGURE 13-2 A cave painting of the glacial era

  3. How do large ice sheets and lower CO2 explain global climate at the last glacial max. ? FIGURE 13-3 Boundary conditions for simulating glacial maximum climate

  4. FIGURE 13-4A The CLIMAP reconstruction of glacial maximum ocean temperatures

  5. FIGURE 13-4B The CLIMAP reconstruction of glacial maximum ocean temperatures

  6. FIGURE 13-5 How thick were the ice sheets?

  7. FIGURE 13-6 Glacial maximum loess

  8. FIGURE 13-7 Desert dust

  9. FIGURE 13-8 Glacial maximum sand dunes

  10. FIGURE 13-9 Data-model comparisons

  11. FIGURE 13-10 Pollen distributions and climate

  12. FIGURE 13-11 Pollen percentages and climate

  13. FIGURE 13-12 Pollen in a lake core

  14. FIGURE 13-13 Modern and glacial maximum spruce

  15. FIGURE 13-14 Biome models

  16. FIGURE 13-15 GCM simulation of climate near the northern ice sheets

  17. FIGURE 13-16 A cooler glacial North Atlantic Ocean

  18. FIGURE 13-17A The glacial Southwest was wetter

  19. FIGURE 13-17B The glacial Southwest was wetter

  20. BOX 13-1A Older Atlantic deep water during glaciations

  21. BOX 13-1B Older Atlantic deep water during glaciations

  22. FIGURE 13-18 Data-model mismatch in the southeastern United States

  23. FIGURE 13-19 Glacial north-central Europe was treeless

  24. FIGURE 13-20 Glacial northern Asia was treeless

  25. FIGURE 13-21 Early human buildings

  26. FIGURE 13-22 Glacial Antarctica was surrounded by more sea ice

  27. FIGURE 13-23 Glacial Australia and South America were drier

  28. FIGURE 13-24 Lower CO2 and CH4 levels cooled the glacial tropics

  29. FIGURE 13-25 Planktic fauna of the glacial maximum vs. that of today

  30. FIGURE 13-26 Independent confirmation of small ocean cooling

  31. FIGURE 13-27 Descent of tropical mountain glaciers and forests

More Related