Download
1 / 16
260 likes | 659 Views
The Last Glacial Maximum (LGM). Lesson 1 Starter Slides on the nature and timing of the LGM. The Last Glacial Maximum defined.

E N D
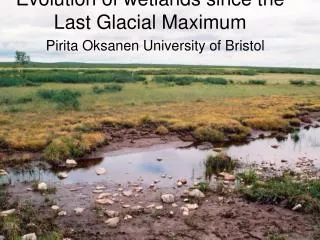
The Last Glacial Maximum (LGM) Lesson 1 Starter Slides on the nature and timing of the LGM
The Last Glacial Maximum defined • The Last Glacial Maximum (LGM) represents the latest phase in Earth’s recent geological history when the planet’s average temperature reached a minimum and the area of land covered by glaciers and ice sheets reached a maximum. NASA During the LGM, (between 26,000 and 18,000 years ago), there was about three times more glacier ice on the planet than there is now.
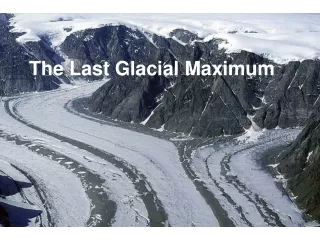
Alpine glaciers like this were much bigger in many mountainous regions of the world during the LGM. Glacier in Baffin Island, Canada (John T. Andrews,INSTAAR and Department of Geological Sciences, University of Colorado,Boulder.) http://www.ncdc.noaa.gov/paleo/slides/slideset/11/11_176_slide.html
This photo from Whistler, British Columbia, Canada, shows evidence for the former presence of a glacier in recent times. During the LGM, the size of a glacier here would have been much larger than the area indicated by this relatively recent lateral moraine. Lateral moraine D.E.Anderson
This photo of the Nisqually Glacier, Mt Rainier, Washington State, shows that the glacier has been a lot larger even very recently. D.E.Anderson
This is how Europe looked during the LGM. • Most of Britain and much of northern Europe was covered by an ice sheet. • Forests could only grow in areas of southern Europe. • The sea-level was about 120 metres lower than now, so the English Channel and North Sea did not exist! www.geocities.com/reginheim/europeiceage.gif Source http://www.earth4567.com/talks/ice.html
This photo taken in Iceland near the edge of an ice cap is how it would have looked in the midlands of England near the edge of the British Ice Sheet during the LGM (without the houses of course!). D.E.Anderson
Extinct animals, like these mammoths and woolly rhinos, ranged across the cold plains of Europe south of the ice sheet during the LGM. commons.wikimedia.org/wiki/Image: Mauricio Antón.jpg Ice age fauna of northern Spain
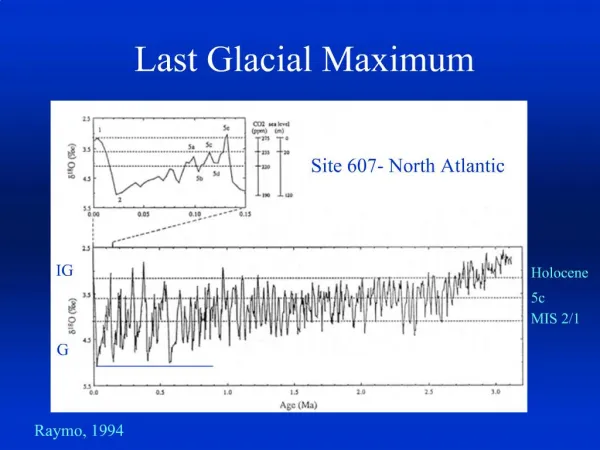
The LGM was just the most recent of many phases of colder climate • During the Quaternary Period (the most recent period of Earth’s geological history) climate has oscillated between cold glacial times and warm interglacial times. The LGM was the coldest part of the most recent ‘glacial’. • The Quaternary Period started 2.6 million years ago and continues. These are two ice core based temp. reconstructions from Antarctica Average global temp. change from today Our present warm time, the Holocene The LGM Wikimedia Commons
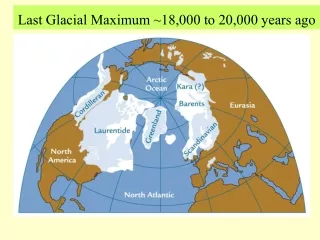
Notice the difference in the extent of ice sheets and sea ice in the Northern and Southern Hemispheres between the LGM and the present day. Mark McCaffrey , NGDC/NOAA Source: http://www.ncdc.noaa.gov/paleo/slides/slideset/11/11_178_slide.html
The LGM and present day compared • Some key facts: • Glaciers cover about 10% of Earth’s land area today (c. 15 mill km2). • During the LGM, about 30% of land area was covered (over 40 mill km2). • Present distribution of glacier ice • 85% of the world’s area covered by glacier ice is accounted for by Antarctica, 11% by Greenland. (Just 4% by everywhere else!) • During the LGM, Antarctica accounted for over 30% of the total area and Greenland about 5%. • The Laurentide Ice Sheet over north-east North America accounted for about 30%, and the Scandinavian Ice Sheet over northern Europe about 15%. • Remember that glacier ice is not the same as sea ice. • The average global temperature was about 6⁰C colder than today. • It was much colder than this at high latitudes, and the cooling was less at lower latitudes nearer to the Equator.
The LGM and present day compared • Sea surface temperatures (SSTs) across the world’s oceans were also lower during the LGM • As with differences over land, the cooling of SSTs was greater at higher latitudes and less at lower latitudes. Wikimedia Commons (Robert A. Rohde) (Compared with today) Note that recent studies suggest that cooling of tropical SST was probably more than shown in this reconstruction by CLIMAP (1981)
Sea-level change during the LGM • Sea-level dropped to about 120 metres below the present level during the LGM. • This happened because more of the world’s H20 was transferred from ocean to glacier ice through the process illustrated here. As ice sheets grow, the ‘store’ of the world’s water in ice increases in proportion to that in the ocean. Wikimedia Commons
This diagram illustrates how sea-level dropped from the previous interglacial time to its lowest point during the LGM. At this point England is cut off from France by the rising sea. Sea-level slightly higher than today 125,000 years ago 0 Depth of English Channel between Dover and Calais -40 -80 Relative sea-level (m) Compared with today -120 10 30 50 70 90 110 Time before present (1000s of years) Sea-level about 120 metres lower c. 20,000 years ago (LGM) Adapted and simplified from Burroughs (2005) Climate Change in Prehistory, Fig. 2.10
Post-glacial change • As the ice sheets melted away in the later stages of the last glacial and during the early part of the Holocene (our current warm interglacial time), sea-level rose. • Sea-level reached a point close to the present level about 8,000 years ago. Wikimedia Commons: Post-Glacial_Sea_Level.png (Robert A. Rohde)
Useful websites to follow up • To view the extent of glacier ice cover across the globe during the LGM and at other times visit: • http://www.ncdc.noaa.gov/cgi-bin/paleo/peltice.pl • To view different times and scenarios of sea-level visit: • http://www.pbs.org/wgbh/nova/vinson/ice.html • To learn more about the LGM and the Ice Ages in general visit: • http://www.earth4567.com/talks/ice.html • http://www.museum.state.il.us/exhibits/ice_ages/