Download
1 / 16
160 likes | 167 Views
CHAPTER 8 Estimating with Confidence. 8.2 Estimating a Population Proportion. Activity: The Beads. Your teacher has a container full of different colored beads. Your goal is to estimate the actual proportion of red beads in the container. Form teams of 3 or 4 students.

E N D
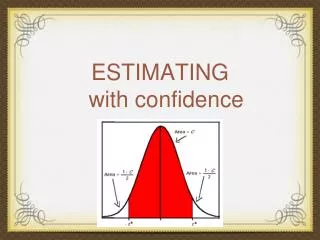
CHAPTER 8Estimating with Confidence 8.2 Estimating a Population Proportion
Activity: The Beads Your teacher has a container full of different colored beads. Your goal is to estimate the actual proportion of red beads in the container. • Form teams of 3 or 4 students. • Determine how to use a cup to get a simple random sample of beads from the container. • Each team is to collect one SRS of beads. • Determine a point estimate for the unknown population proportion. • Find a 95% confidence interval for the parameter p. Consider any conditions that are required for the methods you use. • Compare your results with the other teams in the class.
Conditions for Estimating p Suppose one SRS of beads resulted in 107 red beads and 144 beads of another color. The point estimate for the unknown proportion p of red beads in the population would be How can we use this information to find a confidence interval for p?
Conditions for Estimating p Before constructing a confidence interval for p, you should check some important conditions Conditions for Constructing a Confidence Interval About a Proportion • Random: The data come from a well-designed random sample or randomized experiment. • 10%: When sampling without replacement, check • that • • Large Counts: Both are at least 10.
Example 1: The beads We have a jar full of beads. We want to estimate the number of red beads in the jar. We pull a random sample of 107 red and 144 white beads. Check that the conditions for constructing a CI are met. Random? 10% condition? Large counts?
Constructing a Confidence Interval for p We can use the general formula from Section 8.1 to construct a confidence interval for an unknown population proportion p: When the standard deviation of a statistic is estimated from data, the results is called the standard error of the statistic.
Example 2: 80% confidence Use a table A or your calculator to find the critical value Z* for an 80% CI. (Z* = |Z|) Assume the large counts condition is met
One-Sample z Interval for a Population Proportion Once we find the critical value z*, our confidence interval for the population proportion p is One-Sample z Interval for a Population Proportion When the conditions are met, a C% confidence interval for the unknown proportion p is where z* is the critical value for the standard Normal curve with C% of its area between −z* and z*.
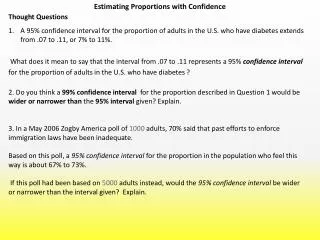
One-Sample z Interval for a Population Proportion Suppose you took an SRS of beads from the container and got 107 red beads and 144 white beads. Calculate and interpret a 90% confidence interval for the proportion of red beads in the container. Your teacher claims 50% of the beads are red. Use your interval to comment on this claim. • Sample proportion = 107/251 = 0.426 • We checked the conditions earlier. • For a 90% confidence level, z* = 1.645 We are 90% confident that the interval from 0.375 to 0.477 captures the true proportion of red beads in the container. Since this interval gives a range of plausible values for p and since 0.5 is not contained in the interval, we have reason to doubt the claim.
The Four Step Process We can use the familiar four-step process whenever a problem asks us to construct and interpret a confidence interval. Confidence Intervals: A Four-Step Process State: What parameter do you want to estimate, and at what confidence level? Plan: Identify the appropriate inference method. Check conditions. Do: If the conditions are met, perform calculations. Conclude: Interpret your interval in the context of the problem.
Example 4: Teens say sex can wait Poll asked 439 US teens 13-17 whether they thought young people should wait to have sex until marriage. 246 said ‘yes’. Construct a 95% CI for the proportion of all teens who would say ‘yes’ is asked this question. (use the 4 step process)
Choosing the Sample Size In planning a study, we may want to choose a sample size that allows us to estimate a population proportion within a given margin of error. The margin of error (ME) in the confidence interval for p is z* is the standard Normal critical value for the level of confidence we want.
Choosing the Sample Size In planning a study, we may want to choose a sample size that allows us to estimate a population proportion within a given margin of error. Calculating a Confidence Interval To determine the sample size n that will yield a level C confidence interval for a population proportion p with a maximum margin of error ME, solve the following inequality for n:
Example: Determining sample size A company has received complaints about its customer service. The managers intend to hire a consultant to carry out a survey of customers. Before contacting the consultant, the company president wants some idea of the sample size that she will be required to pay for. One critical question is the degree of satisfaction with the company’s customer service, measured on a five-point scale. The president wants to estimate the proportion p of customers who are satisfied (that is, who choose either “satisfied” or “very satisfied,” the two highest levels on the five-point scale). She decides that she wants the estimate to be within 3% (0.03) at a 95% confidence level. How large a sample is needed?
Example: Determining sample size Problem: Determine the sample size needed to estimate p within 0.03 with 95% confidence. • The critical value for 95% confidence is z* = 1.96. • We have no idea about the true proportion p of satisfied customers, so we decide to use p-hat = 0.5 as our guess. • Because the company president wants a margin of error of no more than 0.03, we need to solve the equation: • margin of error < 0.03
Example: Determining sample size Because the company president wants a margin of error of no more than 0.03, we need to solve the equation Multiply both sides by square root n and divide both sides by 0.03. Square both sides. We round up to 1068 respondents to ensure that the margin of error is no more than 3%.