Download
1 / 17
170 likes | 175 Views
Industrial Organization Part 1: Costs of Production. MicroMod5. Objectives. By the end of this module, SWBAT Explain the difference between accounting and economic profits and explicit vs. implicit costs Describe the relationship between the production function and total cost curve

E N D
Industrial Organization Part 1: Costs of Production MicroMod5
Objectives • By the end of this module, SWBAT • Explain the difference between accounting and economic profits and explicit vs. implicit costs • Describe the relationship between the production function and total cost curve • Draw and describe the “big three” average cost curves and then show how marginal cost fits in • Explain the benefits of economies of scale in the long run applications of costs of production
SLOs • Corporations routinely focus on decreasing the costs of production for goods and services in order to maximize profit • Understanding costs is a lifelong learning skill in the field of economics that explains much firm behavior • Also, important to understand the externalities of minimizing costs • Layoffs • Tax shelters • Undocumented laborers, migrant laborers, etc.
Recap on Profit • Profit = Total Revenue - Total Cost • Costs come in two flavors • Explicit - costs that require expenditures by business (accountant’s cost) • Implicit - costs that do not require expenditures by businesses (i.e. time, energy, other opportunity costs) • Explicit + implicit costs = total costs
Recap on Profit • in similar fashion, accounting profit = TR - total explicit costs • economic profit = TR - total cost • total cost figure forms the basis for a whole series of curves that provides a detailed picture of supplier behavior
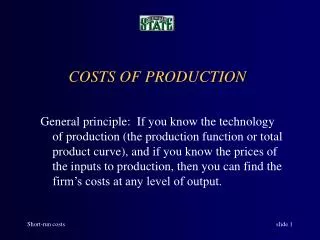
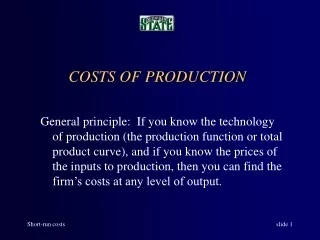
Production Function • relationship between quantity of inputs used to produce and quantity of output • looks like left half of Laffer Curve • diminishing marginal product - as amount of inputs increases, becomes less productive • common sense tells you this is true - “too many cooks in the kitchen” adage
Total Cost Curve • other way to express the same notion as production function • diminishing marginal product due to rising marginal cost
Total Cost Curve Production Function Total Cost Curve
The Big Three • Fixed costs - costs that don’t vary with quantity of goods, services produced • Variable costs - costs that DO vary with quantity of goods, services produced • Marginal cost - increase in total cost that arises from the next unit of good, service
The Big Three - Salon Example • Fixed costs - rent for hair salon • Variable costs - hair product in terms of gel, relaxer, mousse, etc. • Marginal cost - how much the next dye job you do will cost you in terms of materials
Average Total Cost • U-shaped graph • mathematically, it is average fixed cost plus average variable cost • AFC graph shaped like an L, AVC graph shaped like very elastic supply curve • resulting sum in ATC graph becomes a flattened U
Marginal Cost • steepest rise of all cost curves • initially falls with ATC but then quickly rises • whenever MC < ATC, ATC is decreasing • whenever MC > ATC, ATC is increasing • MC always, always, always intersects ATC at ATC’s lowest point • this region called “efficient scale” - place where business operates at lowest cost margin
Long Run vs. Short Run • Long run curves differ from short run curves • recall that even though demander usually more flexible in economic decisions than supplier, fixed short run costs can become variable • (i.e. new production facility, invention of new production techniques)
Long Run vs. Short Run • As a result, long run curves much flatter than short run cost curves in the same way supply and demand curves are more elastic in the long run • three distinct phases • economies of scale (production up, costs down) • constant returns to scale (production up, costs level) • diseconomies of scale (production up, costs up)