Download
1 / 13
150 likes | 606 Views
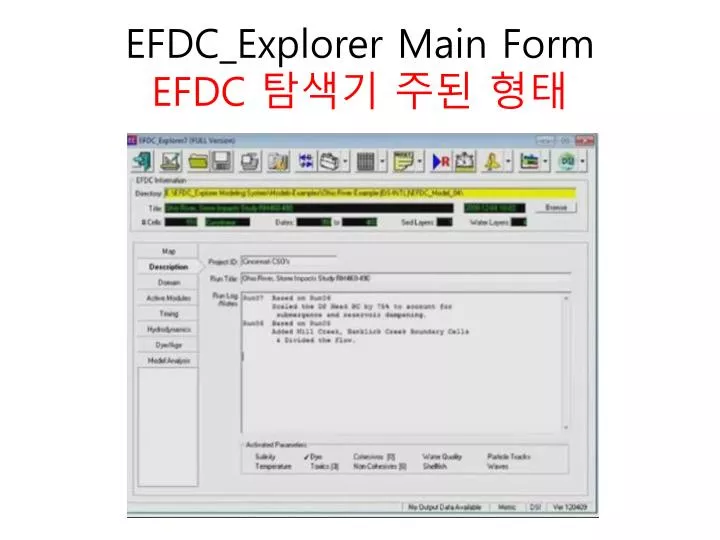
EFDC_Explorer Main Form EFDC 탐색기 주된 형태. EFDC_Explorer Main Features EFDC 탐색기의 주요 특징. GUI for Pre-processing ( 사전처리를 위한 GUI) Grid Development ( 격자 개발 ) Set Initial Conditions ( 초기조건 설정 ) Set Boundary Conditions ( 경계조건 설정 ) QC Checks of Input Data ( 입력정보 QC 확인 )

E N D
EFDC_Explorer Main FeaturesEFDC 탐색기의 주요 특징 • GUI for Pre-processing ( 사전처리를 위한 GUI) • Grid Development ( 격자 개발) • Set Initial Conditions (초기조건 설정) • Set Boundary Conditions(경계조건 설정) • QC Checks of Input Data ( 입력정보 QC확인) • GUI for Post-processing ( 사후처리를 위한 GUI) • Plots and Animaitions of 2D Plan and Vertical Slices of 3D model domain • 2D의 평면과, 3D 모형 영역의 수직부분의 플롯과 에니메이션화 • Point and Volume Weighted Time Series • 타임 시리즈에 무게를 둔 point와 volume • Calibration Plots and Statistical Tools • 교정 플롯과 통계도구 • Flood Extents and Other Model to Model Comparisons • 홍수 크기와 다른 모형과의 비교
EFDC_Explorer7 EnhancementsEFDC 탐색기 향상 • Updated and simplified user interface design • 업데이트와 단순화된 사용자의 인터페이스 디자인(접속 설계) • Rooted Plants & Epiphytes Model (RPEM)(뿌리식물 및 착생 모형(RPEM)) • Automated calibration plots and tables(자동으로 교정된 플롯과 표) • New Group Method for Lagrangian Particle Tracking implemented • 라그랑지안 입자 추적 시행을 위한 새로운 그룹 방법 • Sediment grainsize core management tool(퇴적물 입자크기의 핵심 관리 도구) • Multiple Timing Frames(여러 타이밍 프레임) • Fixed depth and/or elevation extraction of model results : (모형결과의 고정된 깊이와 고도 추줄) • 2D Plan view (2D 평면 view) • Time series / calibration plots(타임시리즈/ 교정 플롯) • Output bitmap images at user defined resolution(사용자 정의 해상도로 출력된 비트맵 이미지) • Write KML files for grid and model 2D fields, Read KML overlays • 2D분야 격자와 모형을 위한 KML 쓰기, KML 영역 겸분 루틴 읽기 • Added a North arrow with defined rotation(북쪽 화살표 추가와 순환 정의) • Redesigned model directory structure to organize input, output, analysis • 새롭게 디자인된 모형의 입력 출력 분석을 구성하는디렉토리 구조 • Regular grid overlay extraction for velocity vector plots(속도 벡터 플롯을 위한 일반적인 격자 overlay 추출) • Further developed ability to user multiple processors(OMP)(여러 프로세서를 사용해 더욱 발전된 능력 ) • Other enhancements and usability improvements(기타 개선 및 사용성개선)
Model Setup 모형 설치
Grid Development격자 개발 • EE contains grid generating functions for constructing horizontal model grids • EE는 수평의 격자모델구조를 위한 격자생성함수를 포함한다. • Provides complete pre-processing capabilities including interpolation of model bathymetry, generation of initial fields such as water surface elevation and salinity to the grid cells and the application of boundary conditions. • 단위격자와 경계조건의 적용을위한 물 표면의 상승과 염분 같은 초기장의 생성, 수심측량술 모형의 보간법을 포함한 완벽한 사전처리 능력을 제공한다. • Capable of generating Cartesian and curvilinear-orthogonal grids using a number of grid generation schemes. • 격자의 그물생성 설계의 수를 이용한 격자 직교곡선 좌표와 데카르트 평면생성을 할 수 있다.
Boundary Condition Assignment경계조건 배치 • Flow(흐름) • Withdrawal/Return • (취소/복구) • Open(EWNS)(개방) • HydraulicStructure • 수리구조물 • At Boundary(경계) • Internal(내부) • EE Management • (EE운영) • By Group(그룹)
Model Calibration • Plots • Time Series • Correlation Plots • Vertical Profiles • Plan View Overlays • Statistics • Average • Relative • Absolute • Root Mean Square • Relative RMS • Nash-Sutcliffe • Model Bias • R-Squared (CP Only)
Calibration Plots and Statistics • User simply provides a linkage of water column model results to measured data. • Once the model/data linkage has been defined once, calibration plots and statistics can be quickly generated after each model run