Download

1 / 24
240 likes | 365 Views
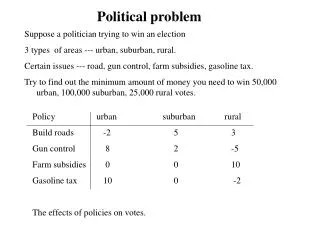
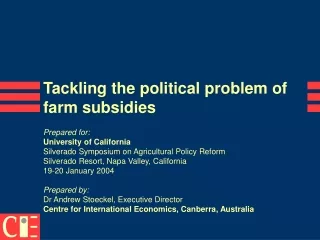
Tackling the political problem of farm subsidies. Prepared for: University of California Silverado Symposium on Agricultural Policy Reform Silverado Resort, Napa Valley, California 19-20 January 2004 Prepared by: Dr Andrew Stoeckel, Executive Director

E N D
Tackling the political problem of farm subsidies Prepared for:University of CaliforniaSilverado Symposium on Agricultural Policy Reform Silverado Resort, Napa Valley, California 19-20 January 2004 Prepared by: Dr Andrew Stoeckel, Executive Director Centre for International Economics, Canberra, Australia
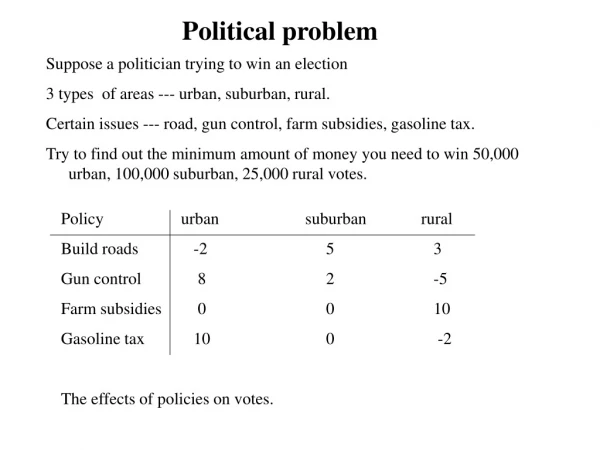
The agricultural trade problem • No reform for fifty years • Political problem • Farmers are a well organised political group • Things have not got much better • But, in general, not worse either
Japan European Union OECD United States Agricultural PSEs for OECD, the United States, Japan and the European Union 70 60 50 40 Producer support estimate (%) 30 20 10 0 1986 1992 1994 1996 1998 2000 1988 1990
The mix of highly distorting and less distorting agricultural subsidies in OECD countries . 70 Less distorting 60 Highly distorting 50 40 Producer support estimate (%) 30 20 10 0 NZ EU USA Swiss Korea Japan Czech Turkey OECD Hungry Iceland Mexico Poland Norway Canada Slovakia Australia
Forces against reform Forces for reform Farmers Forces for and against reform
CBO projections, January 2001 CBO projections, August 2003 CBO projections of total US fiscal surplus/deficit 1000 800 600 400 200 US$ billions 0 -200 -400 -600 2000 2002 2004 2006 2008 2010 2012
Developing countries Taxpayers Consumers Exporters Greens Generally Those facingbarriers Doha Round onlyempowers this group Forces for liberalisation
Doha Round • Based on reciprocal ‘concessions’ • May have worked in the past • No longer working • Success in other areas (nothing left to ‘give’ away) • Flawed logic
A quick quiz of Indonesian journalists GOOD BAD EXPORTS are: 19 0 IMPORTS are: 0 19
Developing countries Taxpayers Consumers Exporters Greens Generally Those facingbarriers Australia’sliberalisation led by this group Doha Round onlyempowers this group Forces for liberalisation
How to engage other groups • Economy-wide analysis • Look beyond the direct to the indirect or secondary effects • Important in Australian liberalisation • Also for New Zealand • Requires a special process • Open, independent, transparent • Changes the politics of protection
Against reform For reform Greens Farmers Forces for liberalisation (continued)
Positive economic Negative economic x 4 Positive environmental 4 Negative environmental x 80% Good and bad subsidies 44 4x x4 xx
Area of private forests Number of sheep Benefits of New Zealand reform 90 1800 80 1600 70 1400 60 1200 Private forest area (000 ha) 50 1000 Sheep numbers (million head) 40 800 30 600 20 400 10 200 0 0 1984 1986 1990 1996 1998 1992 1994 2000 1988
Against reform For reform Developing countries Farmers Forces for liberalisation (continued)
10 Full WTO liberalisation 8 6 4 Own liberalisation 2 0 2000 2001 2002 2003 2004 2005 2006 2007 2008 2009 2010 Welfare gains from trade liberalisation in the Philippines
Preferences and developing countries • Mauritius has preferential access to EU’s sugar market • Benefit: Mauritian sugar (roughly) 0.6 mt x $500 per tonne = $300 million • BUT • Resources used to produce sugar • 93 per cent arable land devoted to sugar • Tourism has limited access to land • ‘Guestworkers’ imported to fill labour gaps
Preferences and developing countries (continued) • Measuring all secondary effects shows Mauritius worse-off • Same story with bananas • Preferences ‘kiss-of-death’
Forces against reform Forces for reform Farmers Forces for and against reform
tonnes 300 250 200 BSEscare 150 100 50 0 1990 1991 1992 1993 1994 1995 1996 1997 1998 1999 2000 2001 Price differentiation, domestic Wagyu beef production: Japan Market liberalisation
Summary • Farm trade liberalisation a political problem • To see reform, have to change the politics • Doha round on its own unlikely to do this • In fact, makes going harder • Sends wrong ‘exports good, imports bad’ message • Need several groups to join forces as a counterweight against those blocking change • Combination of economy-wide analysis and open, independent, transparent process changes the politics of protection