Download
1 / 62
630 likes | 812 Views
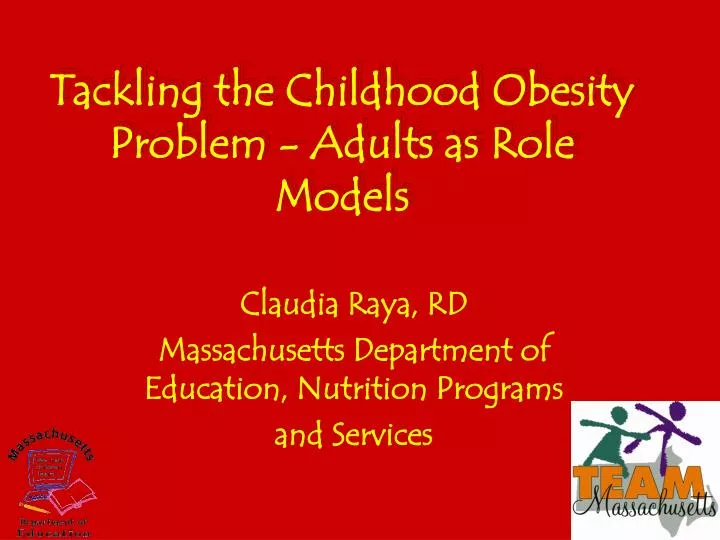
Tackling the Childhood Obesity Problem - Adults as Role Models. Claudia Raya, RD Massachusetts Department of Education, Nutrition Programs and Services. Are we facing a problem with overweight and obesity in the United States?. Age in Years. 6-11. 12-19.

E N D
Tackling the Childhood Obesity Problem - Adults as Role Models Claudia Raya, RD Massachusetts Department of Education, Nutrition Programs and Services
Are we facing a problem with overweight and obesity in the United States?
Age in Years 6-11 12-19 Prevalence of overweight among children and adolescents ages 6-19 years Notes: Excludes pregnant women starting from 1971-1974. Pregnancy status not available for 1963-65 and 1966-70. Data for 1963-65 are for children 6-11 years of age; data for 1966-70 are for adolescents 12-17 years of age, not 12-19. Source: CDCNHCS, NHES, NHANES.
Contributing factors to obesity crisis in U.S. • Environment • Genetics • metabolism, predisposition • Diet/Nutrition Intake • Physical Activity • Cultural/Psychological • Toxic Food Environment
Shifts in Food Practices in the United States • Use of the microwave • Fast food consumption • Consumption of soft drinks - increased from 27 to 44 gal/y from 1972-92 • 30,000 products in supermarkets (doubled since 1981) • 12,000 new food products/year (doubled since 1986)
Contributing Environmental Factors • Environment of “Ease” • cars • decrease in safe walking paths/sidewalks • drive thru society • remote control • internet/TV
Hypothesized Impact of Television Viewing on Obesity Dietary Intake Obesity Television Viewing Inactivity
Dietz WH, Gortmaker SL. Do we fatten our children at the tv set? Obesity and television viewing in children and adolescents. Pediatrics, 1985; 75:807-812. • Gortmaker SL, Must A, Sobol AM, Peterson K, Colditz GA, Dietz WH. Television viewing as a cause of increasing obesity among children in the United States, 1986-1990. Archives of Pediatrics and Adolescent Medicine, 1996;150:356-362.
Consequences of overweight / obesity crisis in U.S. • Overweight children will grow into overweight adults • Medical conditions • chronic diseases • mental disease
Adult Risk of Associated Disease According to BMI 25.0 - 29.9 = Overweight 30.0 - 34.9 = Obese, High 35.0 - 39.9 = Obese, Very High Very High 40 or greater= Extremely Obese Children Risk of Associated Disease According to BMI BMI-for age at or above the 95th percentile of CDC Growth Charts BMI for age > 95th = Overweight BMI for age > 85th and > 95th = At Risk of Overweight http://www.cdc.gov/nccdphp/dnpa/growthcharts/00binaries/growthchart.pdf Evaluation Checklist
Risk of Associated Disease According to BMI and Waist Size Risk of death increases as BMI over 30 increases Obese adults have a 50 - 100 % increased risk of premature death If classified as overweight, losing 5- 10 % of current body weight and keeping it off can begin to alleviate symptoms associated with chronic diseases ( i.e. high blood pressure) and lower risk of developing chronic diseases Surgeon General asks Communities to Address Obesity, healthlink.mcw.edu/article What Do the Numbers Mean?
Increases Risk for Developing Chronic Diseases Diabetes Heart Disease (CVD) Stroke High Blood Pressure Gall bladder disease Some types of Cancer Osteoarthritis Sleep apnea/other breathing problems High blood cholesterol Complications of pregnancy Menstrual irregularities Psychological disorders Increased surgical risk Health Implications of Overweight and Obesity
Health Care Costs for Overweight/Obese Children? • Adult diseases are showing up in children • States and your taxes are paying for their healthcare? • 4 million obese children are recipients of Medicare
Workplace absenteeism lost of productivity depression anxiety higher healthcare premiums US Govt.,States and YOU are paying forhealthcare costs Total cost as of 1995: $99.2 billion http://www.niddk.nih.gov.health.nutrit/pubs/statobes.htm Children 6-17 y.o. 1979-81 $35 million 1997-99 $127 million 300 % increase in costs over 20 years. Wang G and Dietz WH, Pediatrics, 2002, 109 (5) Economic Consequences of Overweight and Obesity
What Can I Do? • Look at you own programs • What does your food resemble? • Are you serving USDA fast food • Is it enough to meet USDA recommended guidelines? • Evaluate your menu Surgeon General asks Communities to Address Obesity,healthlink.mcw.edu/article
What Can I Do? • Look around lunch room? • Do you have vending machines a la carte sales? • Are they in direct competition with school meals program? • Promotions & Fund raisers with food? • What are your school communities’ eating habits? • Surgeon General asks Communities to Address Obesity,healthlink.mcw.edu/article
What Can I Do? • Survey the students, parents, teachers • Invite parents to come eat with kids • Team-up with teachers to encourage healthy eating and PA • Start exercise program at school • Change perception of obesity to focus on improved long-term health Surgeon General asks Communities to Address Obesity ,healthlink.mcw.edu/article
References and Resources • SHPPS, 2000. Department of Health and Human Services, Center for Disease Control and Prevention. http://www.cdc.gov/shpps. • Flegal K; Carroll MD; Ogden CL; et al. Prevalence and Trends in Obesity Among US Adults, 1999-2000. JAMA 2002;288:1723-1727 • The Surgeon General’s Call to Action to Prevent and Decrease Overweight and Obesity • http://www.doe.mass.edu/cnp • http://www.fns.usda.gov/cnd/Default.htm • http://www.fns.usda.gov/cnd/PowerPanther/power.panther.htm
Fighting Obesitywith our Forks and ourFeet…Bite by Bite and Step by Step Erin Coffield, RD, LDN
500,000 400,000 400,000 300,000 300,000 200,000 100,000 90,000 100,000 30,000 20,000 0 Tobacco Diet/Activity Alcohol Microbial Sexual Illicit use of agents behavior drugs Actual Causes of Death in the United States, 1990 Source: McGinnis JM, Foege WH. JAMA 1993;270:2207-12.
Adverse CVD Risk FactorLevels in Children Percent of children, aged 5-10, with 1 or more adverse CVD risk factor levels: 27.1% Percent of overweight children, aged 5-10,with 1 or more adverse CVD risk factor levels: 60.6% Source: Freedman DS et al. Pediatrics 1999; 103:1175-82
High intakes energy total fat saturated fat added sugars Low intakes calcium fiber fruits vegetables dairy whole grains Challenges in the Diets of U.S. Children • Munoz et al. Pediatrics 1997;100:323-329.
Percent of Children Meeting Recommended Intakes Actual: All children 2-19 31.6 Percent Recommended: 6-11 Servings Source: USDA CSFII, 1989-91, From Munoz et al, Pediatrics 100:323, 1997.
Percent of Children Meeting Recommended Intakes Actual: All Children 2-1936.4 Percent Recommended: 3-5 Servings Source: USDA CSFII, 1989-91, From Munoz et al, Pediatrics 100:323, 1997.
Percent of Children Meeting Recommended Intakes Actual: All Children 2-1926.0 Percent Recommended: 2-4 Servings Source: USDA CSFII, 1989-91, From Munoz et al, Pediatrics 100:323, 1997.
5 A Day in Massachusetts Consumption • Present • 31% of adults (BRFSS 2000) • 13% of high school students (2001 YRBSS) consume 5 or more servings of fruits and vegetables a day • Future • National goals • By 2010, 75% meet recommendations • MA 5 A Day Coalition Vision • All residents meet recommendations
Percent of Children Meeting Recommended Intakes Actual: All Children 2-1933.2 Percent Recommended: 2-3 Servings Source: USDA CSFII, 1989-91, From Munoz et al, Pediatrics 100:323, 1997.
Mean calcium (mg) intakes ofU.S. children 1997 DRI USDA CSFII 1994-96, 1998
Children’s milk consumption and calcium intake • Only children who consume milk at the noon-time meal meet their calcium requirements Johnson et al. Child Nutr and Mngt,1998;2:95-100
Children’s beverage consumption patterns Grams US Department of Agriculture
Percent of Children Meeting Recommended Intakes Actual: All Children 2-1928.0 Percent Recommended: 5-7 Ounces Source: USDA CSFII, 1989-91, From Munoz et al, Pediatrics 100:323, 1997.
11% of their calories from soft drinks* 15 teaspoons of sugar per day On Average, Adolescents Aged 12-17 Get: *Soft drinks = carbonated beverages, fruit-flavored and part juice drinks, and sports drinks Source: USDA, Continuing Survey of Food Intake by Individuals, 1994-96
Child health consequences of soft drink consumption • Consumption of sugar-sweetened beverages is associated with childhood obesity* • For every additional serving of sugar-sweetened drink consumed, the odds of becoming obese increased by 60 percent * sugar-sweetened beverages defined as soda, Hawaiian punch, lemonade, Kool-Aid or other sweetened fruit drink, iced tea (not artificially sweetened) Ludwig et al. The Lancet 2001;357:505-508
Nutritional consequences of soft drink consumption Soft drink intake is associated with: • higher energy intakes • lower intakes of vit C, folate, protein, riboflavin, vitamin A, calcium and phosphorus Harnack et al. JADA 1999;99:436-441
Mean intake of added sugars by U.S. children Guthrie and Morton JADA 2000;100:43-48.
Sources of added sugars in the U.S. diet Guthrie and Morton, JADA 2000;100:43-48.
How to Eat a Healthy Diet USDA Food Guide Pyramid
The Pyramid -- Unstacked
Food Groups & Key Nutrients Unlock the Pyramid • Grain iron, fiber • Vegetables vit. A, vit. C, fiber • Fruit vit. A, vit. C, fiber • Meat protein, iron • Dairy protein, calcium • Fats, Sweets and others
USDA Nutrients • P rotein • I ron • C vitamin • C alcium • A vitamin • Fat (<30% total fat) • Saturated fat (<10% saturated fat)