Download

1 / 11
110 likes | 187 Views
ANOVA Analysis of Variance A Short Introduction by Brad Morantz. Example. Have data for miss distances for 3 types of weather: Clear and sunny Rain Fog The question: Does the weather have effect on miss distances?

E N D
ANOVAAnalysis of VarianceA Short Introduction byBrad Morantz
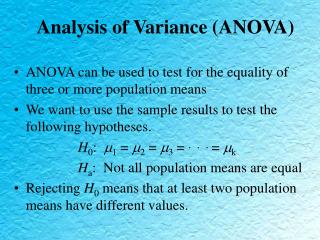
Example • Have data for miss distances for 3 types of weather: • Clear and sunny • Rain • Fog • The question: • Does the weather have effect on miss distances? • Are the population means for each condition equal (within allowable tolerance)?
The Problem • There is variability in the system. • Each time a missile is fired • Many variables: wind, brightness of sun, countermeasures, precipitation, much more • Expect to get different values each time • How can we tell if certain factors actually are causing a difference? • Each repetition is different • How do we know when some variance is too much • How do we know if a certain factor is having an affect
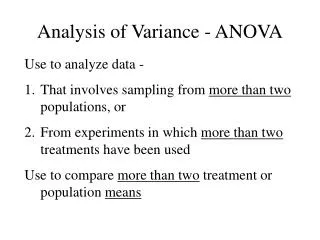
The Solution • ANOVA = ANalysis Of VAriance • This is for a single dependent variable • Can also be ‘blocked’ to control other things, called noise reducing • For example, to group flights by distance or over time • Need more data/observations to do this • Must be of comparable variance • Can also be used for two factor test • e.g velocity and weather
Overview & Purpose • Null Hypothesis H0 is that all means are equal (population means as estimated by sample means) μ1 = μ2 = . . . . = μn • If we reject the null, it signifies that we could not prove that all are equal within allotted variability in system • Does NOT mean that all are different • Use another test (Tukey’s HSD) to see which one(s) is/are different
Components • SSE is sum of square error • SST is total sum of squares SST = SSTreatment + SSError • MST = SST/(k-1) • MSE = SSE/(N-k) • F = MST/MSE The test criteria to reject or fail to reject null hypothesis • k = number of treatments • N = number of observations
Interpretation • Program will usually give critical value • Depending on specified allowed tail • If F value is more than critical value • Then reject null hypothesis • If F value is less than critical value • Then Fail to reject the null hypothesis • Check to make sure that variances are approximately equal/close • Look at graph of data • is it approximately bell shaped?
Blocked ANOVA • Variance and noise reducing technique • Use when there are more than one factor • Ex. Day of the week has affect • Ex. Type of launch aircraft • Would still allow to see if weather had affect • Requires more observations
Manova • Multivariate Analysis of Variance • When there are two or more dependent variables • Need specialized high power (read expensive) software
Limitations • Assumes that all of the data is approximately normally distributed • Assumes that all of the data has about the same variance • Is only concerned with the estimates of the population means that were calculated from the samples
Example These value are made up values Note that the variances are close F critical given as 3.35 and the calculated value is 5.32 so we reject the null hypothesis that all means are equal. The P value is the probability of obtaining a result at least as extreme as a given data point, under the null hypothesis. Note that the P value is .011 which indicates that if we had chosen an alpha of .01, the null would not be rejected.