Download

1 / 25
250 likes | 364 Views
Android Debug. 建國科技大學資管系 饒瑞佶 2012/4. Debug 兩三事. 善用 Eclipse 提供的工具 (snippets 、 log) 與錯誤判別 ( 紅色底線 ) 利用 AlertDialog 或 Toast 印出階段結果 注意 AndroidManifest.xml 內需要開的權限 還是要多寫. Android Debug. 開發環境 Eclipse 的 LogCat 訊息視窗 Console, Problems… Logcat 自行加入顯示訊息 Toast AlterDialog … 透過 log 類別 +LogCat 視窗

E N D
Android Debug 建國科技大學資管系 饒瑞佶 2012/4
Debug兩三事 • 善用Eclipse提供的工具(snippets、log)與錯誤判別(紅色底線) • 利用AlertDialog或Toast印出階段結果 • 注意AndroidManifest.xml內需要開的權限 • 還是要多寫
Android Debug • 開發環境Eclipse的LogCat訊息視窗 • Console, Problems… • Logcat • 自行加入顯示訊息 • Toast • AlterDialog … • 透過log類別+LogCat視窗 • Try…Catch… • 設定中斷點與追蹤變數值
Eclipse的LogCat訊息視窗 Java Code Console LogCat 這裡是重點
錯誤訊息 這裡就是錯誤 而且是明顯的
錯誤訊息 大部分錯誤都有提示解法 只要把滑鼠靠近錯誤位置就可以
錯誤訊息 是最常看到的錯誤訊息 誰可以給我答案?
錯誤訊息 這裡有答案,不過…
開啟Eclipse的行號 顯示行號
自行加入顯示訊息-Toast 語法: Toast.makeText(this, 要顯示的文字資訊, Toast.LENGTH_SHORT).show(); • 放置原始碼內要顯示資訊的位置 • 訊息將自動顯示與關閉
自行加入顯示訊息- AlterDialog 語法: new AlertDialog.Builder(this) .setTitle(“視窗文字") .setMessage(“顯示訊息文字”) .setPositiveButton("確認",new DialogInterface.OnClickListener() { public void onClick(DialogInterface dialog, int which) { // TODO Auto-generated method stub } }) .show(); 需要: import android.app.AlertDialog; import android.content.DialogInterface; • 放置原始碼內要顯示資訊的位置 • 訊息不會自動關閉
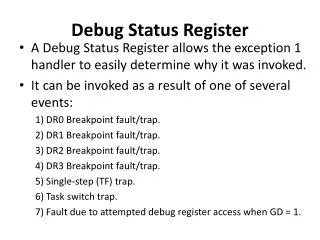
log類別+LogCat視窗 • 訊息分五類: • 冗長訊息(Verbose) • 除錯訊息(Debug) • 通知訊息(Info) • 警告訊息(Warning) • 錯誤訊息(Error)
log類別+LogCat視窗 • Log 類別提供了五個方法:v, d, i, w, e • 方法定義: • 方法(標籤,訊息) • 方法:欲傳送冗長訊息時就使用v,欲傳送除錯訊息時就使用d,以此類推 • 標籤:為LogCat 的視窗中Tag 那一欄所顯示的文字,標籤可以任意字串,未來可以用其過濾訊息 • 訊息:即LogCat 子視窗中Message 那一欄所顯示的文字 需要: import android.util.Log; 例如: Log.v("MyMessage", "This line was executed."); Log.e("MyMessage", "submit is null.");
log類別+LogCat視窗 可點選LogCat 子視窗右上角綠色的十字圖示來建立一個過濾器:
Try…Catch… try{ 程式碼 }catch(Exception e){ Toast.makeText(this, e.getMessage(), Toast.LENGTH_SHORT).show(); }
設定中斷點與追蹤變數值 breakpoint
設定中斷點與追蹤變數值 開啟顯示Display視窗
設定中斷點與追蹤變數值 停在中斷點時,可以選取要觀察的參數或變數,按組合鍵CTRL + SHIFT + D,就會出現目前變數的值 再按CTRL + SHIFT + D,就會將變數值顯示在Display視窗 按F6,就會從中斷點往下執行
設定中斷點與追蹤變數值 ALT + SHIFT + ↑或ALT +SHIFT + ↓選取大括號區塊 可以知道該行程式被哪個大括號區塊涵蓋
程式效能追蹤 啟動效能記錄: Debug.startMethodTracing( "traceFileName" ); 停止效能紀錄: Debug.stopMethodTracing( ); 需要: import android.os.Debug; 加入WRITE_EXTERNAL_STORAGE 的 permission 記錄位置: sdcard 取出紀錄: adb pull /sdcard/traceFileName.trace . 檢視紀錄: traceview 目前路徑\traceFileName.trace
程式效能追蹤 檢視紀錄: traceview 目前路徑\traceFileName.trace 1.Name:所有調用項2.Incl:inclusive時間占總時間的白分比3.Inclusive: 調用占用時間.(包括了所有的子方法的調用時間)4.Excl: 執行占總時間的百分比5.Exclusive: 執行時間,不包含子方法的時間6.Calls+Recur Calls/Total: 調用和重復調用的次數7.Time/Call: 總的時間。(ms)