Download
1 / 15
150 likes | 318 Views
ZONAL SLOPE OF THE THERMOCLINE IN THE EQUATORIAL INDIAN OCEAN FROM ALTIMETER AND ARGO OBSERVATIONS. MM Ali 1 , Udaya Bhaskar 2 and M Ravichandran 2 1 National Remote Sensing Agency 2 International Centre for Ocean Information Services Hyderabad 500037 India Email: mmali73@yahoo.com.

E N D
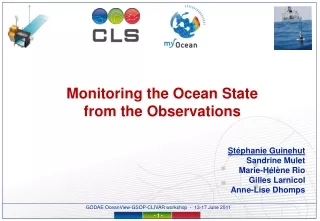
ZONAL SLOPE OF THE THERMOCLINE IN THE EQUATORIAL INDIAN OCEAN FROM ALTIMETER AND ARGO OBSERVATIONS MM Ali1, Udaya Bhaskar2 and M Ravichandran2 1National Remote Sensing Agency 2 International Centre for Ocean Information Services Hyderabad 500037 India Email: mmali73@yahoo.com
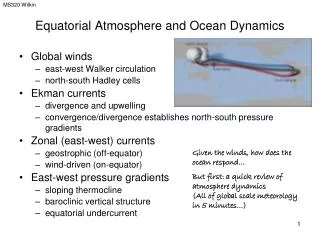
Equatorial Indian Ocean (EIO: 5 S to 5 N & 50 to 110 E) behaves uniquely compared to other oceanic regions due to reversal of monsoon winds. • Non-monsoon months: Equator – 8oN westward flowing north equatorial current Equator – 8oS eastward flowing equatorial counter current • Monsoon months: 8oS – 8oN A jet of surface waters moves from west to east
Water piles up at the eastern end of the basin creating a west to east up-slope • This results in a west-east down-slope in the thermocline • This phenomena occurs every year with different year to year variations in intensities
Years Monthly SSH Slope Anomalies (deg.) Along the EIO (2S-2N; 40-100 E) During 1994-2005 From Topex/Poseidon & Jason The negative (positive) slope during July-September corresponds to the warm (cold) phase
Surface slopes can be obtained from altimeter observations • In situ measurements are required to obtain thermocline slopes (Argo is the best platform) Best Approach: To model the dynamic system from first principles using equations of motion In absence of such a perfect physical model: Use statistical approaches governing physical processes Assumption: Estimation of D20 can be modelled from chaotic nature of a non linear and deterministic dynamics In this study Artificial Neural Network (ANN) approach is used to estimate D20 from surface parameters.
Data: • SSHA from Jason, monthly SSHA (MSSHA) from Jason w.r.t. 1993-2002 Topex mean • D20 from Argo floats • Climatological D20 from WOA01 Period:2003-2005 Approach: • D20 from Argo floats (i) Predictors: longitudes, month, climatological D20, 1993-2002 monthly average SSHA from Topex, SSHA from Jason, monthly SSH anomalies from Jason wrt 1993-2002 monthly means (ii) Predictand: D20 • Radial Basis Function with one hidden layer and 265 neurons • Analysed separately for 2002-2005 and 2005 • One single ANN model used for the entire area
ANN model needs three sets of data: 2003-05 2005 % Training: 1816 736 50% Testing: 908 367 25% Predicting: 908 367 25%
Statistical Analysis for D20 during (2003-05)(2005) Predictions
Scatter of in situ and Predicted D20 (m) Predi2005ction 2003-2005
Histograms of Difference Between In Situ and Predicted D20 (m) 2003-2005 2005 64% (86%) of the estimations lye within ±10 m for 2003-2005 (2005)
Why 2005 result is better? Thermosteric effects (though small) may be different Thermocline could be due to factors other than SSH To improve the accuracy: Inclusion of windstress (vector) Analysis for different sectors Studying the effect of thermosteric anomalies