Download
1 / 31
310 likes | 314 Views
This article discusses the evolution and experience of the New Jersey Shelf Observing System, including operational models, real-time ensemble forecasts, and the integration of various observational platforms. The article also explores the use of satellites and RADAR in the observing system.

E N D
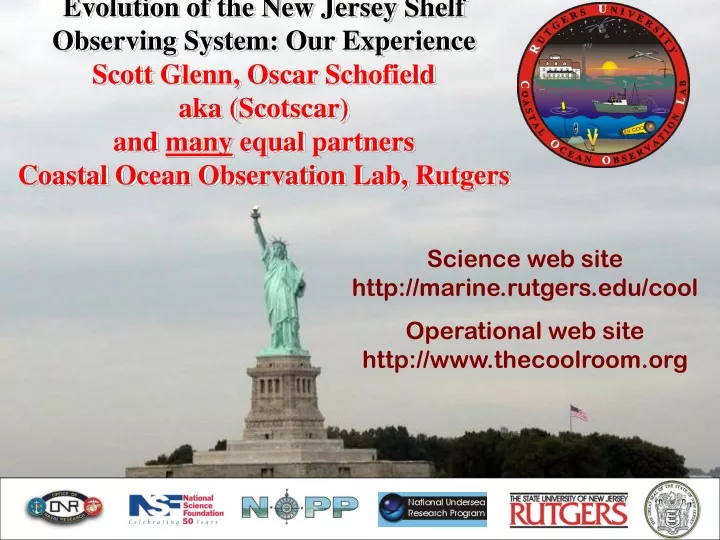
Evolution of the New Jersey Shelf Observing System: Our Experience Scott Glenn, Oscar Schofield aka (Scotscar)and many equal partnersCoastal Ocean Observation Lab, Rutgers Science web site http://marine.rutgers.edu/cool Operational web site http://www.thecoolroom.org
ROMs Assimilation MODAS Assimilation Atmosphere/Ocean Physical/Biological Forecast Models Operational Low-Res COAMPS Atmospheric Model Experimental High-Res RAMS Atmospheric Model Air-Sea Interaction Model ROMS Ocean Model (KPP and MY 2.5 Turbulent Closure) Bottom Boundary Layer Model
Real-Time Ensemble Validation HR COAMPS / ROMS 2 4 6 8 10 12 KPP Depth (m) 2 4 6 8 10 12 26 24 22 20 18 16 14 12 10 8 Depth (m) 2 4 6 8 10 12 Depth (m) MY2.5 18 18 18 19 19 19 20 20 20 21 21 21 July, 2001 July, 2001 July, 2001 Thermistor • In an observationally rich • environment, ensemble forecasts • can be compared to real-time data • to assess which model is closer to reality • and try to understand why.
3-D visualization Forecast Briefing Hindcast Models EcoSim Bio-Optical Model Atmosphere/Ocean Physical/Biological Forecast Models Operational Low-Res COAMPS Atmospheric Model Experimental High-Res COAMPS Atmospheric Model Air-Sea Interaction Model ROMS Ocean Model (KPP and MY 2.5 Turbulent Closure) Bottom Boundary Layer Model
International Constellation of Ocean Color Satellites X-Band Earth Observing Satellites EOS (MODIS) USA 2001 NEMO (COIS) USA 2004 Orbview-2 (SeaWiFS) USA Op. HY-1 (COCTS/CZI) China 2002 FY1-C (MVISR) China Op. FY1-D (MVISR) China 2002 IRS-P3 (MOS) India Op. IRS-P4 (OCM) India Op. ADEOS-2 Japan 2002 (GLI/POLDER) ENVISAT(MERIS) Europe 2002
CODAR Total Vector Calculation Kilometers CODAR North 0 5 10 Little Egg Harbor CODAR Central Site Great Bay LEO-15 A T L A N T I C O C E A N CODAR South Atlantic City
Radial Velocity Map Brant Beach Site Brigantine Site 25 km A 25 cm/s
1998 1999 2000 2001 Test
Red Tide Observed at 790 nm on 22 July 2000 With the PHILLS Sensor 100 meters
Ship-to-Shore Communications Towed Instruments Profiling Instruments
Ceratium fusus c a b Bioluminescence Potential 1e6 4e10 Photons/sec/ml 0 6 12 Depth (m) 18 24 a 0 1.0 2.0 Distance (km)
Scientists want real-time observational nowcasts and model forecasts …. DO REAL PEOPLE CARE?
Rutgers Web Site Statistics Data Type Other 14% NODES 13% CODAR 17% Gulf Stream 10% MET 17% LEO 6% Non-profit (7%) Rutgers Web Site Statistics By Hour SST 53% Education (6%) East Coast 19% 8000 June General Public 69% 7000 Military & Government(4%) July 6000 August NYB 37% 5000 Average Hourly Hits September 4000 October 3000 November 2000 MAB 28% December 1000 January 0 Region 0:00 3:00 6:00 9:00 12:00 15:00 18:00 21:00 What they want KPAR
New Jersey Shelf Observing System (NJ-SOS) 300 X 300 km NJSOS An Integrated & Sustained Observatory Satellites, RADAR, Gliders
Regional-scale Observatories Process Studies Where do we go from here? Satellites CODAR Node/Moorings Ships/AUVs Gliders Sustained 2001 Integrated
Nested Multi-Static CODAR Array Beach Buoys Boats
1998 1999 2000 2001
Slocum Battery Glider Specifications Weight: 52 Kg Hull Diameter: 21.3 cm Vehicle Length: 1.5 meters Depth Range: 4 - 200 meters Speed: 0.4 m/sec horizontal Energy: Alkaline Batteries Nominal Payload: 4 Kg Endurance: Average, 30 days Range: 1500 km Navigation: GPS, and internal dead reckoning, altimeter Communications: RF modem, Iridium, ARGOS, Acoustic modem
-Up to10-day deployments -Control shifted from local (NJ) and remotely (MA)