Download

1 / 8
670 likes | 2.47k Views
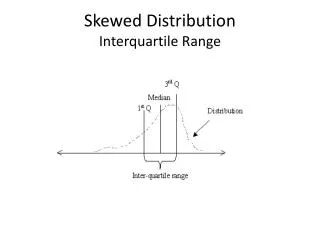
Interquartile Range. Interquartile Range (1/7). I nter Q uartile R ange (1/7). ( The Range of the middle 50% of scores ). IQR = . Q3 – Q1. What are Q3 and Q1 ?. Q1 is the lower quartile of 25 th percentile . Q3 is the upper quartile of 75 th percentile . Example 1

E N D
Interquartile Range
Interquartile Range (1/7) InterQuartile Range (1/7) (The Range of the middle 50% of scores) IQR = Q3 – Q1 What are Q3 and Q1? Q1 is the lower quartile of 25th percentile. Q3 is the upper quartile of 75th percentile. Example 1 1, 3, 5, 6, 7, 8, 8 Median = 6 End of Slide Q1 = Q3 = 3 8 IQR = Q3 - Q1 Middle of lower half. Middle of top half. = 8 - 3 = 5
Interquartile Range (2/7) Example 2 2, 3, 6, 6, 7, 8. Median = 6 Q1 = Q3 = 3 7 IQR = Q3 - Q1 = 7 - 3 Middle of lower half. Middle of top half. = 4 Example 3 2, 3, 5, 6, 7, 9, 9, 10. Median = 6.5 Q1 = Q3 = 4 9 IQR = Q3 - Q1 = 9 - 4 Middle of lower half. Middle of top half. = 5 End of Slide
Interquartile Range and Dot Plots (3/7) 0 1 2 3 4 5 6 7 8 Median Q3 Q1 IQR = Q3 – Q1 = 5 – 2 = 3 End of Slide
Interquartile Range and Stem-and-Leaf (4/7) Stem Leaf 0 1 2 3 4 5 0 1 2 6 Q1 1 3 3 5 6 Median IQR = Q3 – Q1 4 4 5 7 7 9 9 = 38 – 13 2 3 4 6 8 Q3 5 7 7 9 = 25 0 5 End of Slide
Interquartile Range - Box-and-Whisker (5/7) C D E B A A – Upper Extreme B – Lower Extreme C – Median D – Upper Quartile – Q3 E – Lower Quartile – Q1 End of Slide
Interquartile Range - Box-and-Whisker (6/7) 0 2 4 6 8 10 12 14 16 Q3 Q1 IQR = Q3 – Q1 = 13 – 3 = 10 End of Slide
IQR – 5 Number Summary (7/7) 0 2 4 6 8 10 12 14 16 Q3 Q1 Median Lower Extreme Upper Extreme Lower Extreme, Lower Quartile, Median, Upper Quartile, Upper Extreme 1, 3, 8, 13, 16 End of Slide