Download
1 / 30
590 likes | 1.62k Views
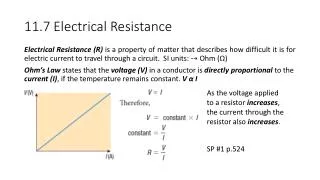
Electrical Resistance Tomography. Quak Foo Lee Department of Chemical and Biological Engineering The University of British Columbia. Learning Objectives. By the end of this presentation, you should be able to: Describe the basic concept and applications of ERT

E N D
Electrical Resistance Tomography Quak Foo Lee Department of Chemical and Biological Engineering The University of British Columbia
Learning Objectives • By the end of this presentation, you should be able to: • Describe the basic concept and applications of ERT • Design the electrodes for ERT system • Understanding different basic measurement strategies and image reconstruction • Analyze the ERT data through different numerical and Statistical data analyses
ERT Outline • Background • Applications and Examples • Operating Principle • Electrode Geometry and Construction • Measurement Strategies • Image Reconstruction • Data Analyses • Summary
Background to ERT • A measurement technique for obtaining information about the contents of process vessels and pipelines. • Multiple electrodes are arranged around the boundary of the vessel at fixed location. • The electrodes make electrical contact with the fluid inside the vessel BUT do not affect the flow or movement of materials.
Application • A typical application is real time monitoring of multicomponent flows within process engineering units. • Use in any process where the main continuous phase is at least slightly conducting and the other phases and components have different values of conductivity.
Examples • Solid/liquid and liquid/gas mixing • Hydrocyclones • Packed columns • Flotation columns • Precipitation processes • Liquid-liquid extraction • Hydraulic conveying
Operating Principles • An ERT system produces a cross-sectional image showing the distribution of electrical conductivity of the contents of a process vessel or pipeline from measurements taking at the boundary of the vessel. • The P2000 system injects a current between a pair of electrodes and measures the resultant voltage difference between remaining electrode pairs according to a pre-defined measurements protocol.
Operating Principles (…cont) • This interrogates an entire “slice” through the measurement zone – analogous to a “body-scan” in medical imaging. • A single measurement set consists of over 100 voltage measurements – the exact number depends on the pre-defined measurement protocol.
Electrode Geometry & Construction Electrodes arranged at equal intervals around the boundary of a circular vessel.
Electrode Arrangements • At equal intervals around the boundary of a circular vessel • Around a square cross-section • A vertical series of electrodes
Electrode Geometry & Construction • The electrodes are connected to the data acquisition system by co-axial cable which assists in reducing the effect of extraneous environmental noise and interference. • The outer sheath of the co-axial cable is coupled to the feedback path of a voltage buffer to provide further noise immunity and the inner core is capacitively coupled to the input of the voltage buffer.
Electrode Geometry & Construction • The material of electrode should be more conductive than the fluids being imaged to prevent problems due to contact impedance. • Typically the electrode material is stainless steel, brass or silver palladium alloy.
Electrode Geometry & Construction • The dimensions of the electrodes are a function of the vessel diameter, range of conductivity to be measured, velocity of materials and the required imaging speed. • A spare electrode, referred to as the ground electrode, positioned away from the measurement electrodes BUT in electrical contact with the internal fluid is required to ensure all voltage measurements are fixed against a common ground source.
Electrode Diameter Inter-Electrode Gap Electrode Design Electrode Diameter -------------------------- = 0.4 Inter-Electrode Gap
Data Acquisition System • Responsible for obtaining the quantitative data • Describing the state of the conductivity distribution inside the pipeline • The data must be collected quickly and accurately in order to track small changes of conductivity in real-time • Allowing the image reconstruction algorithm to provide an accurate measurement of the true conductivity distribution.
MS: Normal Adjacent • Recommended measurement strategy for sensors with insulating boundaries with 16 electrodes arranged at equal intervals around the periphery of the sensor.
MS: Normal Adjacent • Current is applied through two neighboring electrodes (e.g. electrodes 1 and 2), • The voltages are measured from the remaining pairs of neighboring electrodes (e.g. electrodes 3 and 4), • Current is then applied through the next pair of electrodes and the voltage measurements are repeated. • The procedure is repeated until all the independent measurements have been made.
MS: Normal Adjacent • Yields N2 measurements, where N is the number of electrodes. • Of these only N(N-1)/2 are independent. • To avoid electrode/electrolyte contact impedance problems, the voltage is not measured at a current injecting electrode and the total number of independent measurements M is reduced to N(N-3)/2. • A 16-electrode sensor gives 104 independent measurements.
MS: Fast Adjacent • Only suitable for fast data collection when no on-line image processing is performed. • The principles are the same as those described for the normal adjacent strategy.
MS: Linear • Used when a vertical series of electrodes mounted either on a linear rod or fixed along the inside of a vessel.
MS: Conducting Boundary • Applied to pipelines and vessels with conducting boundaries, e.g., stainless steel pipes. • The relatively large surface area of the conducting boundary is employed as the current sink to reduce the common-mode voltage across the voltage across the measurement electrodes. • The earthed conducting boundary also acts as a shield, reducing the effects of electromagnetic interference.
Image Reconstruction • For an ERT system the reconstructed image will contain information on the cross-sectional distribution of the electrical conductivity of the contents within the measurement plane. • A square grid with 20 × 20 = 400 pixels represents the vessel interior cross-section. • Some of these pixels will lie outside the vessel circumference. • The circular image is constructed using 316 pixels from the 400 pixel square grid.
The Forward Problem – Sensitivity Map • Forward? Because σ(x,y) is known everywhere inside the sensor. • The task is to find the boundary voltage measurements, given the injection current I applied to the electrode s and the conductivity distribution σ(x,y) at all points. • Solve the forward problem by calculation of a sensitivity map which describes the behavior of the sensor.
The Inverse Problem • To determine the conductivity distribution σ(x,y) from a finite number of boundary voltage measurements. • The linear back-projection algorithm back projects the voltage measurements to conductivity values within the pixels. • The image is reconstructed via a matrix/vector multiplication.
Linear Backprojection Algorithm • The potential difference is calculated by the forward solver, between two equipotentials on the boundary was back-projected to a resistivity value in the area enclosed by the two lines for all possible injection/measurement combinations.
Linear Backprojection Algorithm • Gives the relative difference between the conductivity distribution in the test set and that of a single reference set. • The algorithm assumes that no sharp conductivity differences exist in the measurement plane, and smoothes interfaces where severe conductivity gradients exist.
Numerical and Statistical Data Analyses • Voltage Measurements and Graphs • Conductivity Tomogram • Pixel Range • Resistivity (raw) • Mean Pixel Conductivity • Pixel Trace • Mixing Statistics • Concentration • Scatter Plots • Average Across Frames
Limitations of ERT System • A time lag between measurements made in planes one and eight. • A resolution of 5 to 10% of the vessel diameter. • Greater image sensitivity at the periphery of the vessel. • The tomograms in the upper-most and lowest plane show distortions due to end effects related to the three-dimensional nature of the electric field not accounted for during the two-dimensional reconstruction of the planar image.