Download
1 / 31
320 likes | 599 Views
The Generation of X-Rays. EPS 400-002 Introduction to X-ray Diffraction Instructor: Jim Connolly. A bit of History. William Roentgen discovered X-rays in 1895 and determined they had the following properties Travel in straight lines

E N D
The Generation of X-Rays EPS 400-002Introduction to X-ray Diffraction Instructor: Jim Connolly
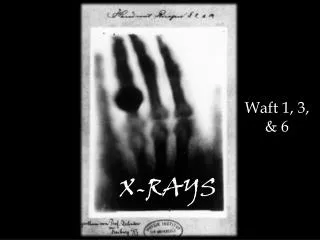
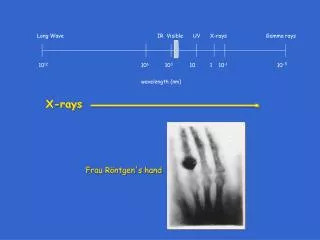
A bit of History • William Roentgen discovered X-rays in 1895 and determined they had the following properties • Travel in straight lines • Are exponentially absorbed in matter with the exponent proportional to the mass of the absorbing material • Darken photographic plates • Make shadows of absorbing material on photosensitive paper • Roentgen was awarded the Nobel Prize in 1901 • Debate over the wave vs. particle nature of X-rays led the development of relativity and quantum mechanics
Discovery of Diffraction • Max von Laue theorized that if X-rays were waves, the wavelengths must be extremely small (on the order of 10-10 meters) • If true, the regular structure of crystalline materials should be “viewable” using X-rays • His experiment used an X-ray source directed into a lead box containing an oriented crystal with a photographic plate behind the box • The image created showed: • The lattice of the crystal produced a series of regular spots from concentration of the x-ray intensity as it passed through the crystal and • Demonstrated the wave character of the x-rays • Proved that x-rays could be diffracted by crystalline materials Von Laue’s results were published in 1912
Bragg’s “Extensions” of Diffraction • Lawrence Bragg and his father W.H. Bragg discovered that diffraction could be treated as reflection from evenly spaced planes if monochromatic x-radiation was used • Bragg’s Law: n = 2d sinwhere n is an integer is the wavelength of the X-radiationd is the interplanar spacing in the crystalline material and is the diffraction angle • The Bragg Law makes X-ray powder diffraction possible
Notes on Units of Measure • an angstrom (Å) is 10-10 meters • a nanometer (nm) is 10-9 meters • a micrometer (m) or micron is 10-6 meters • a millimeter (mm) is 10-3 meters In X-ray crystallography, d-spacings and X-ray wavelengths are commonly given in angstroms
PDF#46-1212: QM=Star(S); d=Diffractometer; I=Diffractometer Corundum, syn Al2 O3 Radiation=CuKa1 Lambda=1.540562 Filter= Calibration= 2T=25.578-88.994 I/Ic(RIR)= Ref: Huang, T., Parrish, W., Masciocchi, N., Wang, P. Adv. X-Ray Anal., v33 p295 (1990) Rhombohedral - (Unknown), R-3c (167) Z=6 mp= CELL: 4.7587 x 4.7587 x 12.9929 <90.0 x 90.0 x 120.0> P.S=hR10 (Al2 O3) Density(c)=3.987 Density(m)=3.39A Mwt=101.96 Vol=254.81 F(25)=357.4(.0028,25/0) Ref: Acta Crystallogr., Sec. B: Structural Science, v49 p973 (1993) Strong Lines: 2.55/X 1.60/9 2.09/7 3.48/5 1.74/3 1.24/3 1.37/3 1.40/2 2.38/2 1.51/1 NOTE: The sample is an alumina plate as received from ICDD. Unit cell computed from dobs. 2-Theta d(Å) I(f) ( h k l ) Theta 1/(2d) 2pi/d n^2 25.578 3.4797 45.0 ( 0 1 2) 12.789 0.1437 1.8056 35.152 2.5508 100.0 ( 1 0 4) 17.576 0.1960 2.4632 37.776 2.3795 21.0 ( 1 1 0) 18.888 0.2101 2.6406 41.675 2.1654 2.0 ( 0 0 6) 20.837 0.2309 2.9016 43.355 2.0853 66.0 ( 1 1 3) 21.678 0.2398 3.0131 46.175 1.9643 1.0 ( 2 0 2) 23.087 0.2545 3.1987 52.549 1.7401 34.0 ( 0 2 4) 26.274 0.2873 3.6109 57.496 1.6016 89.0 ( 1 1 6) 28.748 0.3122 3.9232 59.739 1.5467 1.0 ( 2 1 1) 29.869 0.3233 4.0624 61.117 1.5151 2.0 ( 1 2 2) 30.558 0.3300 4.1472 61.298 1.5110 14.0 ( 0 1 8) 30.649 0.3309 4.1583 66.519 1.4045 23.0 ( 2 1 4) 33.259 0.3560 4.4735 68.212 1.3737 27.0 ( 3 0 0) 34.106 0.3640 4.5738 70.418 1.3360 1.0 ( 1 2 5) 35.209 0.3743 4.7030 74.297 1.2756 2.0 ( 2 0 8) 37.148 0.3920 4.9259 76.869 1.2392 29.0 ( 1 0 10) 38.435 0.4035 5.0706 77.224 1.2343 12.0 ( 1 1 9) 38.612 0.4051 5.0903 80.419 1.1932 1.0 ( 2 1 7) 40.210 0.4191 5.2660 80.698 1.1897 2.0 ( 2 2 0) 40.349 0.4203 5.2812 83.215 1.1600 1.0 ( 3 0 6) 41.607 0.4310 5.4164 84.356 1.1472 3.0 ( 2 2 3) 42.178 0.4358 5.4769 85.140 1.1386 <1 ( 1 3 1) 42.570 0.4391 5.5181 86.360 1.1257 2.0 ( 3 1 2) 43.180 0.4442 5.5818 86.501 1.1242 3.0 ( 1 2 8) 43.250 0.4448 5.5891 88.994 1.0990 9.0 ( 0 2 10) 44.497 0.4549 5.7170
Generating X-rays for Diffraction • To get an accurate picture of the structure of a crystalline material requires X-radiation that is as close to monochromatic as possible. • The function of the x-ray tube and associated electronics is to produce a limited frequency range of high-intensity x-rays. • Filters, monochromators, specially tuned detectors and software are then used to further refine the frequency used in the analysis.
The X-ray Tube • Schematic cross section of an X-ray tube as used in our lab • The anode is a pure metal. Cu, Mo, Fe, Co and Cr are in common use in XRD applications. Cu is used on our Scintag system • Cu, Co and Mo will be available on our new systems • The tube is cooled by water and housed in a shielding aluminum tower
HV Power Supply Schematic • In most systems, the anode (at top in 8) is kept at ground • #2 (KV) and #7 (ma) are what are adjusted on the power supply with #1 and #5 • In our lab, we only routinely adjust filament current (#5) from operating (35 ma) to “idle” (10 ma) levels
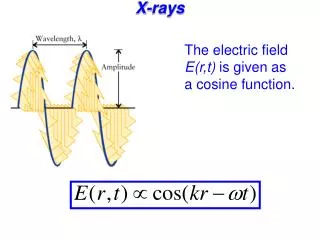
X-rays may be described as waves and particles, having both wavelength () and energy (E) In the equations at left: E is the energy of the electron flux in KeV h is Planck’s constant (4.135 x 10⁻¹⁵ eVs) v is the frequency c is the speed of light (3 x 10¹⁸ Å/s) is the wavelength in Å Substituting (1) into (2) yields (3), the relationship between wavelength and energy. In (4) all constants are substituted Generation of X-rays (1) (2) (3) (4)
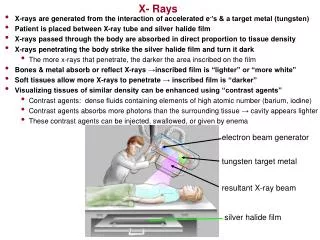
Continuous Spectrum • X-rays are produced whenever matter is irradiated with a beam of high-energy charged particles or photons • In an x-ray tube, the interactions are between the electrons and the target. Since energy must be conserved, the energy loss from the interaction results in the release of x-ray photons • The energy (wavelength) will be equal to the energy loss (Equation 4). • This process generates a broad band of continuous radiation (a.k.a. bremsstrahlung or white radiation)
Continuous Spectrum • The minimum wavelength ( in angstroms) is dependent on the accelerating potential ( in KV) of the electrons, by the equation above. • The continuum reaches a maximum intensity at a wavelength of about 1.5 to 2 times the min as indicated by the shape of the curve
Generating Characteristic Radiation • The photoelectric effect is responsible for generation of characteristic x-rays. Qualitatively here’s what is happening: • An incoming high-energy photoelectron disloges a k-shell electron in the target, leaving a vacancy in the shell • An outer shell electron then “jumps” to fill the vacancy • A characteristic x-ray (equivalent to the energy change in the “jump”) is generated L-shell to K-shell jump produces a K x-ray M-shell to K-shell jump produces a K x-ray
The Copper K Spectrum • The diagram at left shows the 5 possible Cu K transitions • L to K “jumps: • K1 (8.045 keV, 1.5406Å) • K2 (8.025 keV, 1.5444Å) • M to K • K1 K3 (8.903 keV, 1.3922Å) • K 5 Note: The energy of the K transitions is higher that that of the K transitions, but because they are much less frequent, intensity is lower
Anode K1 (100) K2 (50) K (15) Cu 1.54060 1.54439 1.39222 Cr 2.28970 2.29361 2.08487 Fe 1.93604 1.93998 1.75661 Co 1.78897 1.79285 1.62079 Mo 0.70930 0.71359 0.63229 Characteristic Wavelength values (in Å) for Common Anode Materials * Relative intensities are shown in parentheses
Making Monochromatic X-rays • X-rays coming out of the tube will include the continuum, and the characteristic K1, K2, and K radiations • A variety of methods may be used to convert this radiation into something effectively monochromatic for diffraction analysis: • Use of a filter • Use of proportional detector and pulse height selection • Use of a Si(Li) solid-state detector • Use of a diffracted- or primary-beam monochromator
Filters • There are two types of absorption of x-rays. • Mass absorption is linear and dependent on mass • Photoelectric absorption is based on quantum interactions and will increase up to a particular wavelength, then drop abruptly • By careful selection of the correct absorber, photoelectric absorption can be used to select a “filter” to remove most radiation while “passing” most radiation
Target K (Å) -filter Thickness (m) Density (g/cc) % K % K Cr 2.291 V 11 6.00 58 3 Fe 1.937 Mn 11 7.43 59 3 Co 1.791 Fe 12 7.87 57 3 Cu 1.542 Ni 15 8.90 52 2 Mo 0.710 Zr 81 6.50 44 1 Filters for Common Anodes Note: Thickness is selected for max/min attenuation/transmission Standard practice is to choose a filter thickness where the : is between 25:1 and 50:1
Filtration of the Cu Spectrum by a Ni Filter • The Ni absorption edge lies between the K and K peaks • Note the jump in the continuum to the left of the K peak from Cu self-absorption • Note that the Ni filter does little to remove the high-energy high-intensity portion of the continuum Filter Placement: • In a diffractometer, the filter may be placed on the tube or detector side. • In powder cameras (or systems with large 2D detectors), the filter will be between the tube and the camera (or specimen).
Discriminating with Detectors • Pulse-height Discrimination • Detector electronics are set to limit the energy of x-rays seen by the detector to a threshold level • Effectively removes the most of the continuum and radiation produced by sample fluorescence • Particularly effective combined with a crystal monochromator • “Tunable” Detectors • Modern solid state detectors, are capable of extremely good energy resolution • Can selectively “see” only K or K energy • No other filtration is necessary, thus signal to noise ratios can be extremely high • Can negatively impact intensity of signal
Monochromators • Following the Bragg law, each component wavelength of a polychromatic beam of radiation directed at a single crystal of known orientation and d-spacing will be diffracted at a discrete angle • Monochromators make use of this fact to selectively remove radiation outside of a tunable energy range, and pass only the radiation of interest • A filter selectively attenuates K and has limited effect on other wavelengths of X-rays • a monochromator selectively passes the desired wavelength and attenuates everything else. • Monochromators may be placed anywhere in the diffractometer signal path
Pyroliltic Graphite curved-crystal Monochromator • A planar crystal will diffract over a very small angular range and significantly reduce the intensity of the x-ray signal • Precisely “bent” and machined synthetic crystals allow a divergent x-ray beam to be focused effectively with minimal signal loss The pyrolitic graphite curved crystal monochromator is the most widely used type in XRD laboratories
Graphite Monochromator on ScintagDiffractometer Diffracted-beam parallel geometry From left: Receiving scatter slit, soller slit assembly, receiving slit, monochromator (path bends) and scintillation detector
Summary • A Ni filter will attenuate Cu K radiation, but pass almost everything else (including high-energy portions of the background spectrum) • A Si(Li) detector may be tuned to see only K radiation • A graphite (PG) monochromator will select Cu K, but the acceptance windows will also admit a few other wavelengths. A tungsten (W) L line may be present as anode contamination in an “aged” Cu x-ray tube • Compton scatter will always contribute something to the background