Download
1 / 134
1.37k likes | 1.54k Views
Quantitative aspects of IR spectroscopy as applied to adsorbed species Edoardo Garrone Dipartimento di Scienze dei Materiali ed Ingegneria Chimica, Politecnico di Torino, Corso Duca degli Abruzzi 24, 10129 Torino Italy.

E N D
Quantitative aspects of IR spectroscopy as applied to adsorbed species Edoardo Garrone Dipartimento di Scienze dei Materiali ed Ingegneria Chimica, Politecnico di Torino, Corso Duca degli Abruzzi 24, 10129 Torino Italy
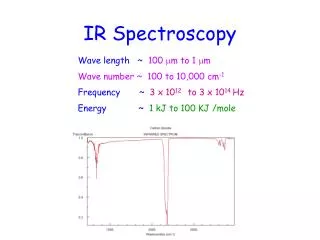
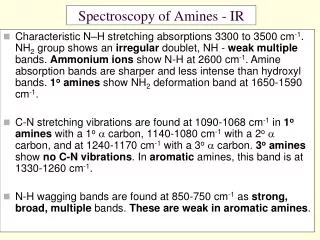
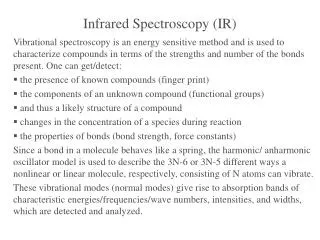
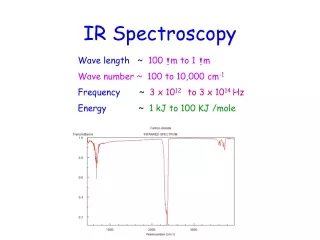
IR spectroscopy: mainly a qualitative technique, useful for recognising species • Group frequencies: • carbonylic groups C=O at 1700-1750 cm-1, • Si-H groups around 2200 cm-1, etc. • [e.g. G. Socrates, Infrared and Raman characteristic group frequencies: tables and charts. (2001) Wiley, Chichester, United Kingdom]
Examples of qualitative use of IR Spectroscopy concerning adsorbed species • carbon dioxide on basic oxides: carbonate species may be formed, and/or species molecularly adsorbed onto cations • (G. Ramis, G. Busca, V. Lorenzelli, Mater. Chem. Phys. 29 (1991) 425) • pyridine (or ammonia) adsorption: Brønsted or Lewis sites revealed by the formation of pyridinium (ammonium) species, or molecularly bound species • (H. Knözinger, Adv. Catal. 25 (1976) 184)
A puzzling case concerning ethylene dissociative adsorption with extended metal surfaces: ethylidene species C-CH3 (C. E. Anson, N. Sheppard, D. B. Powell, J. R. Norton, W. Fischer, R. L. Keiter, B.F.G.Johnson, J.Lewis, A.K. Bhattacharrya, S. A. R. Knox, M. L. Turner, J. Am. Chem. Soc. 116 (1994) 3058)
IR Spectroscopy also yields information on the local symmetry and the types of bonds • carbonate species (unidentate, bidentate, etc) • carbonylic species (CO on metals): “on- • top”, bidentate, tridentate CO species, with • different C-O bond order and frequencies, all • below 2143 cm-1 (isolated molecule) • adsorption of CO on cations: C-O stretch with a • frequency usually > 2143 cm-1
Much less developed the quantitative use of IR spectroscopy of surface species!
Most common measurement type in the case of adsorbed species is transmission. • Also available: • Diffuse Reflectance (DRIFT) techniques • Attenuated Total Reflection (ATR) or Grazing Angle • with metal ideal surfaces, the appropriate version of • vibrational spectroscopy is the Electron Energy Loss • Spectroscopy (EELS)
In the present survey, only transmission measurements are considered!
Types of transmission cells: a few categories, according to the working temperature (T), and the its control. • Those working at room T. The actual temperature of the sample is slightly higher than the ambient (heating effect of the IR beam), and not precisely known. If pressure p changes, the temperature of the sample is also not strictly constant. • Those working at fixed low T (coolant bath, usually liquid nitrogen at the NBP). The temperature is nominally 77 K: the actual temperature is higher (typically ca. 100 K), and not strictly constant with pressure
To vacuum line thermal treatments KBr windows Cell with small optical path, working at RT
To vacuum line Liquid N2 KBr windows Sample holder (Cu) Thermal treatments IR cell working at low temperature ca. 100 K
A few cells work at variable T • A) A.A. Tsyganenko: allows accurate measurement of T and p, but not their control. It works in a T range below ambient. Changes in T and p are slow enough so that equilibrium phenomena can be followed • B) A. Zecchina and co-workers: equipped with a cryostat: strict control over T. It works below ambient T and may operate down to 4 K. • C) A commercial cell (AABSPEC) working at controlled T and p also in a range above room T. Limited dead volume (few cubic centimetres)
Tsiganenko cell: T variable, but not controlled (C.Otero Areán, O.V. Manoilova, A.A. Tsyganenko, G. Turnes Palomino, M. Peñarroya Mentruit, G. Geobaldo, E. Garrone, Eur. J. Inorg. Chem. (2001) 1739)
Zecchina cell: cryostat down to liquid He (G. Spoto, E. N. Gribov, G. Ricchiardi, A. Damin, D. Scarano, S. Bordiga, C. Lamberti, A. Zecchina, Prog. Surf. Sci. 76 (2004) 71)
Commercial: also for T higher than ambient http://www.aabspec.com
For simplicity, from now on an adsorbate showing only one band will be considered
Measurable quantities for an IR band: i) frequency (peak position) ii) intensity (either at the peak or integrated intensity) iii) half-width iv) other parameters entering the analytical representation of the band: e.g., fraction of Lorentzian and Gaussian functions
Frequency (peak position) most readily measured quantity
Information on the adsorbing centre comes from the perturbation of a significant IR mode (e.g., stretching mode of CO) from a reference value (unperturbed molecule) Usually, the stronger the interaction, the larger the perturbation. In simple cases, when considering a set of similar systems, the extent of perturbation has a quantitative meaning.
Correlations of the frequency (more commonly, the shift) with: • the adsorption enthalpy, measured • independently • another frequency of the same system • the frequency of another (similar) system • another feature of the same IR band (e.g. • halfwidth)
- the adsorption enthalpy, measured independently • another frequency of the same system • the frequency of another (similar) system • another feature of the same IR band (e.g. halfwidth)
Two examples: • CO adsorbed on cations • H-bonding
CO adsorbed on cations either non d, d0 or d10, (non classical carbonyls, with stretching frequencies higher than the isolated molecule) Linear dependence between calorimetrically measured heats of adsorption and the hypsochromic shift:
Correlation between CO shift and heat of adsorption for non-d carbonyls Shift is positive with respect to 2143 cm-1 Non d cations Cu carbonyls • V. Bolis, A. Barbaglia, S. Bordiga, C. Lamberti, A. Zecchina, J. Phys. Chem. B 108 (2004) 9970.
Only electrostatics involved, no proper chemical bond If double interactions take place with both ends of the CO molecule as in Al-rich zeolites, the linear relationship does not hold lower frequency and larger interaction enthalpy (C. Otero Areán, M. Rodriguez Delgado, C. Lopez Bauçà, L. Vrbka, P. Nachtigall, Phys. Chem. Chem. Phys. 9 (2007) 457)
H-bonding: the shift of the O-H stretch Δν(O-H) measures the strength of H-bond • A few formulas proposed: electrostatics basically involved! • Classical work by N. Sheppard and G.C.Pimentel. • (N. Sheppard, in Hydrogen Bonding, ed. D. Hadzi, Pergamon Press, London, 1959, p. 85. • G. C. Pimentel and A. L. McClellan, in The Hydrogen Bond, W. H. Freeman and Co., San Francisco, 1960).
the adsorption enthalpy, measured independently • another frequency of the same system • the frequency of another (similar) system • another feature of the same IR band (e.g. halfwidth)
Correlation between two different modes of the same type of adduct. CO H-bonded to different acidic hydroxyls: the C-O frequency linearly correlated to Δν (O-H) (O. Cairon, T. Chevreau, J.C. Lavalley, J. Chem. Soc. Faraday Trans. 94 (1998) 3039)
the adsorption enthalpy, measured independently • another frequency of the same system • the frequency of another (similar) system • another feature of the same IR band (e.g. halfwidth)
Example: the silanolin phenylene Periodic Mesoporous Organosilica (PMO) H-bonded to molecules with increasingly basic character
1,4diphenylene PMO Inagaki, S.; Guan, S.; Ohsuna, T.; Terasaki, O. Nature 2002, 416, 304.
Computer models periodic cluster Onida, B.; Borello, L.; Busco, C.; Ugliengo, P.; Goto, Y.; Inagaki, S.; Garrone, E. J.Phys. Chem. B, 109 (2005) 11961
Increasing basicity N2 CO C6H6 Propene Mesitylene Cyclohexene Acetone Ammonia
Bellamy-Hallam-William plot • Comparison of the shifts suffered by the O-H stretch of silanols in: • phenylene PMO • amorphous silica • Proportionality constant: a measure of the relative acidity of the two O-H species
Proportionality constant ca. 0.96 Silanol in PMO slightly less acidic than in silica For bridged OH species in zeolites proportionality constant ca. 3 (much more acidic!) Deviations may occur!
SAPO-40 ZSM-5 MCM-22 THETA SAPO-40 Benzene and mesytilene show deviations with respect to the BHW plot
H-ZSM-5 Benzene and toluene show deviations
C3H6 C2H4 C6H6 (CH3)2CO Hindrance of the interaction by the surroundings free hindered
the adsorption enthalpy, measured independently • another frequency of the same system • the frequency of another (similar) system • another feature of the same IR band (e.g. halfwidth, intensity)
In H-bonding, the larger the shift, the wider and the more intense the band of the stretching mode of the O-H species engaged Quantitative relationships are known
N2 CO C6H6 Propene Mesitylene Cyclohexene Acetone Ammonia
Intensity More troublesome quantity
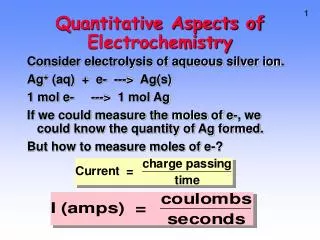
IR transmission experiment concerning solutions: measurement of the population of absorbing centres through the classical Lambert-Beer law (LBL) A = absorbance; k = absorption coefficient; c = concentration of absorbing centres; d = thickness of the sample; ε = molar extinction coefficient, LBL: A = k d = ε c d
IRS measurements concerning a pellet: A = ε N/ S S = geometrical surface of the pellet N = number of moles of adsorbing centres in the whole sample ε = molar extinction coefficient
Absorbance measures the number of moles in the sample! quantitative aspects! • Two reasons could impede the applicability of LBL: • the presence of scattering because of the powder structure of the samples; • a change in the environment of the absorbing centres due to a change in pressure, in reversible adsorptions (not really important)
Treatment of scattering: Schuster-Kubelka-Munk model (the same for Diffuse Reflectance) A forward flux I and a backward flux J: -dI/dx = (k + s) I – s J + dJ/dx = -s I + (k + s) J s = scattering coefficient, k = absorption coefficient • (G. Kortum, Reflectance spectroscopy : principles, methods, applications. (1969), Sprinter-Verlag, New York)
T = [1 - R2] exp [- b s d] / 1 - R2 exp [- 2 b s d] • b = [(1 + k/s)2 - 1]1/2; • d = sample thickness, • R = reflectance of the sample at infinite thickness • R = 1 + k/s - [(k/s)2 + 2 k/s] 1/2 • In case of moderate scattering (s < 10% k), • ln T = Aapp sd + kd + (s/k) 2 [1 – kd]
k depends on the concentration c, s does not. k = k0 + ε N/Ss = s0 (k0 = absorption of the solid alone): k is growing with coverage Result: in case of moderate scattering (s < 10% k), LBL holds (small offset, the term sd). For larger values of s/k, deviations may occur. Note: scatter of radiation is more often due to voids in the sample than to the actual particles. Silica samples, white when powdered, tend to become transparent when pelleted. The condition s << k is more readily fulfilled for pelleted samples than for loose powders
Example showing that the intensity of a band has to be considered with care: Porous silicon Also shows a peculiar way of making a quantitative use of IR spectroscopy!