Download
1 / 32
320 likes | 467 Views
Graphing Linear Inequalities. Section 6.8 EVERYONE GET A COMMUNICATOR!!! One side blank, other side graph. How to Determine the Type of Line to Draw. Choose the type of line for the inequality given. 1. y > 3x - 2 a. Solid b. Dotted 2. y > ¼x - 5 a. Solid b. Dotted.

E N D
Graphing Linear Inequalities Section 6.8 EVERYONE GET A COMMUNICATOR!!! One side blank, other side graph
How to Determine the Type of Line to Draw
Choose the type of line for the inequality given. 1. y > 3x - 2 a. Solid b. Dotted 2. y > ¼x - 5 a. Solid b. Dotted
Choose the inequality symbol for the line shown. < or > < or >
Choose the inequality symbol for the line shown. < or > < or >
Graph y > x - 2. 1. Graph the line y = x - 2. x 2. Since y >, shade above the line. y
Graph y < x - 2. 1. Graph the line y = x - 2. x 2. Since y <, shade below the line. y
Do you do anything different when the line is dotted rather than solid? Lesson Start
Not Really Lesson Start
Graph y > x - 2. 1. Graph the line y = x - 2, but make the line dotted. x 2. Since y >, shade above the line. y
Graph y < x - 2. 1. Graph the line y = x - 2, but make the line dotted. x 2. Since y <, shade below the line. y
Graph y > -½x + 3 Type of line: Solid Dotted x y
Graph y > -½x + 3 Type of line: Solid Dotted x Shade ___ the line. y Above Below Lesson Start
Graph y > -½x + 3 Type of line: Solid Dotted x Shade ___ the line. y Above Below
Choose the correct inequality for the graph shown. y < 1/3 x + 2 y < 1/3 x + 2 x y > 1/3 x + 2 y > 1/3 x + 2 y
Where to Shade for Undefined or No Slopes: The inequality must be in x # (no y) format. can be: >, >, <, or <.
Graph x > -2 1. Draw a dotted vertical line at x = -2. x 2. Shade to the right of the line. y
Graph x < -2. 1. Graph the line X = -2. x 2. Shade to the left of the line. y
Graph x > 3. Choose type of line. Solid Dotted x y
Graph x > 3. Choose type of line. Solid x Choose where to shade. Left Right y
Graph x > 3. Choose type of line. Solid x Choose where to shade. Right y
Solve -3x - 2y < 12. +3x +3x -2y < 3x + 12 -2 -2 -2 y < -3/2 x - 6 >
Choose the correct inequality. 1. 2x + 5y > -10 y < 2/5 x + 2 y > 2/5 x + 2 y > -2/5 x - 2 y < -2/5 x - 2 2. 3x - 2y > 10 y < -2/3 x - 5 y > -2/3 x - 5 y > 2/3 x - 5 y < 2/3 x - 5
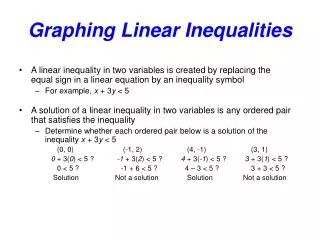
Example 1 • Which ordered pair is a solution of 5x - 2y ≤ 6? • (0, -3) • (5, 5) • (1, -2) • (3, 3)
y 5 x -5 -5 5 Example 2 • Graph the inequality x ≤ 4 in a coordinate plane. • Decide whether to use a solid or dashed line. • Use (0, 0) as a test point. • Shade where the solutions will be.
y 5 x -5 -5 5 Example 3 • Graph 3x - 4y > 12 in a coordinate plane. • Sketch the boundary line of the graph. • Solve for “y” first: • y < ¾x - 3 • Solid or dashed line? • Use (0, 0) as a test point. • Shade where the solutions are.
y 5 x -5 -5 5 Example 4: • Graph y < 2/5x in a coordinate plane. • What is the slope and y-intercept? • m = 2/5 • b = (0,0) • Solid or dashed line? • Use a test point OTHER than the origin. • Shade where the solutions are.
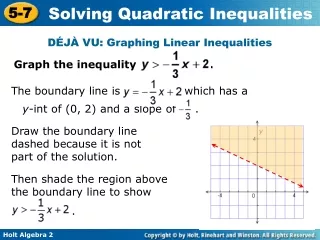
Graph: y ≥ -3/2x + 1 Step 1: graph the boundary (the line is solid ≥) Step 2: test a point NOT On the line (0,0) is always The easiest if it’s Not on the line!! 3(0) + 2(0) ≥ 2 0 ≥ 2 Not a solution So shade the other side of the line!!