Download
1 / 47
470 likes | 548 Views
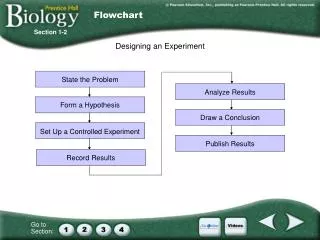
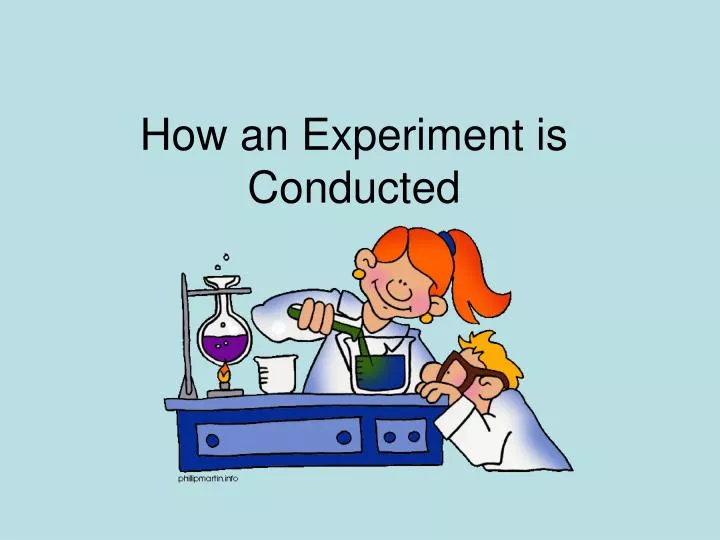
How an Experiment is Conducted. Identifying and Writing a Problem Statement. The problem is the first step of the scientific method. Only one variable at a time should be tested so that the results can be easily clarified. Examples of testable Problems. Which flavor of gum last the longest?

E N D
Identifying and Writing a Problem Statement The problem is the first step of the scientific method. Only one variable at a time should be tested so that the results can be easily clarified.
Examples of testable Problems • Which flavor of gum last the longest? • Which brand of toilet paper is the strongest? • How many pennies can fit in a cup full of water without it overflowing? • What factor causes mold to grow on bread the quickest? • Which type of battery will last the longest?
Your Turn to Write a Testable Problem Create three examples of testable problems. Remember that you should only be testing on variable at a time. • ________________________________________________________________ • ________________________________________________________________ • ________________________________________________________________
Conducting Research Research involves gathering background information related to your experiment from another source. Name some ways or sources you could use to gather information for an experiment. • Ex: Scientific Encyclopedia_____________________ • __________________________________________ • __________________________________________ • __________________________________________ • __________________________________________
Creating a Hypothesis A hypothesis is a prediction or educated guess as to what you believe the outcome of your experiment will be based on research or general knowledge. Your hypothesis must always be written as an “If …., then …” statement before the experiment is conducted. If a hypothesis is wrong after the experiment is completed, that does not indicate that the experiment was a failure. Some great ideas and inventions have resulted from incorrect hypotheses. Just as much knowledge, if not more can be gained form an incorrect hypothesis as from a correct one.
Examples of Problems and Hypotheses. • What is the effect of cigarette smoke on household plants? IfI test to see how cigarette smoke affects plant, thenit will ________________________________________. 2. In a natural filtration system, how should rocks, sand, and dirt be layered to get the cleanest water? If I test to see how materials in a natural filtration system should be layered, then their order from top to bottom will be __________________________________________. 3. How does exercise affect heart rate? IfI test to determine how exercise affects the heart rate, then it will ____________________________.
Practice Writing a Hypothesis Write a hypothesis for each of the following problems using an “If…, then …” statement. Example Problem: Which is a more effective heat source, coal, natural gas or electricity? Hypothesis: If coal, natural gas and electricity are tested to see which provides the warmest heat in the shortest time, then it will be natural gas.
Write a hypothesis for each of the following problems using an “If…, then …” statement. • Which brand of soap gets rid of germs the best? Hypothesis If _____________, ___________, and ___________ soap are tested to determine which gets rid of germs best then, _________ will work best. 2. Which brand of sneakers will allow you to jump the highest? Hypothesis: If __________________________________________ are tested to determine which will allow you to _________________________ then, the ___________________ will work _______________? 3. How many pounds of weight can be held by a bridge made out of 30 popsicle sticks? Hypothesis: _____ weights are placed on a bridge made of ________________ then, the bridge will be able to hold _______________ before it breaks.
Write a Hypothesis for these 2 problems completely on your own. 1. Which soft drink; Coke, Sprite or Dr. Pepper is the most corrosive? Hypothesis: 2. Will a 40, 60 or 100 watt light bulb last the longest? Hypothesis:
Variables A variable is a factor that can affect the outcome of an experiment. There are 3 types of variables: • ConstantVariables The variable(s) in an experiment that are kept the same. Examples • Same amount of sunlight • Same amount of water • Same size and type of pot • Same type of soil
2. Independent variable The experimental variable, or the variable that is changed. This is what you are testing, what you have control over. You can change or alter this variable in the experiment. Example: Iffertilizeris fed to a tomato plant then the plant will produce larger tomatoes because the fertilizer helps the plant grow and produce bigger fruit. The fertilizer is the independent variable. You have control over whether it is added or not. It is the variable you are experimenting with or that you can change. It is the independent variable.
Dependent variableThe variable that is effected by the independent variable. This is the variable that you measure or observe during your experiment. Example: Iffertilizer is fed to a tomato plant then the plant will produce larger tomatoesbecause the fertilizer helps the plant grow and produce bigger fruit. The tomato sizeis thedependent variable. The size of the tomatoes is effected by the fertilizer. Tomato size is the variable you are measuring and observing during the experiment. The fertilizer which is the independent variable may or may not effect the size of the tomatoes.
Writing a Materials List The materials list should be written in list form, with each item numbered. All materials or substances, their amounts, and any needed equipment must be included. Here is an example for an experiment which tests to see how many styrofoam peanuts can be dissolve in 1/3 cup of acetone. Materials List: 1. 1500 (or more) styrofoam peanuts 2. 1 can of acetone (any size) 3. 1/3 cup measuring cup 4. 1 clear jar
Your Turn to Write a Materials List Below create a materials list for the ingredient and materials needed to make a hot fudge sundae.
Materials needed to make a banana split • 1 banana (sliced in half) • ½ cup whip topping • 3 teasponns of chopped nuts • 1 cherry • 1 ice cream scoop • 1 bowl • 1 spoon • Measuring spoons • 3 scoops of Vanilla ice cream (1/2 cup for each scoop) • ¼ cup of chocolate syrup • ¼ cup ofpineapple ice cream topping • ¼ cup of strawberry ice cream topping
Writing the Procedure The procedure should be written in list form, with each step numbered. This makes it much easier to follow. Clear, precise, and detailed directions should be given in each step. It is essential that you give good directions that others can easily repeat your experiment exactly, without questioning any part of it.
Steps for “Dissolving Styrofoam Peanuts” Procedure • Gather materials. • Pour 1/3 cup of acetone into the jar. • Begin putting Styrofoam peanuts into the jar one at a time, counting out loud as you go. • Continue putting peanuts into the jar until they no longer dissolve.
In the space below, write the procedures for making a hot fudge sundae.
Procedures for making a banana split. • Gather materials. • Open ice cream and put three scoops in a bowl. • Peel the banana and slice it into ¼ inch thick slices • Put the banana slice around the ice cream scoops. • Open the chocolate syrup, and the jars of pineapple and strawberry topping. • Using the spoon put approximately ¼ cup of pineapple topping on one scoop of the ice cream. • Repeat step 6 using the chocolate syrup and the strawberry topping. • Spray approximately ½ cup of whip topping over the top of the ice cream. • Measure ¼ cup of chopped nuts and sprinkle over the whip topping. • Place 1 cherry on top of the center scoop of ice cream. • Put remain ingredients away and enjoy eating your banana split.
Collecting Data Collecting data requires observations. When we think about observations, most of us automatically think of the sense of sight, since that is the sense we most often use to observe; however, scientific observation may require the use of your other senses as well. (smell, touch, hearing, taste and sight). In science we often record one of two types of data. • Qualitative data or observations which involve the use of our sense to record things we see, smell, hear, feel or taste. Or • Quantitative data or observations that involve numbers or amounts. To record our observations we use table and graphs.
Qualitative vs. Quantitative Observations Read each statement carefully. Decide if the statement is a qualitative or quantitative statement and place an X in the appropriate answer box.
Data Tables Data tables are an excellent way to display information. After putting information in a table you can easily set up a graph to illustrate the data. Tables have several features in common. • All tables as well as graphs should have a title to let the reader know the subject of the table or graph. • Most tables consist of a series of rows and columns. These rows and columns intersect to form cells. • A row is a series of cells going horizontally across the table. • A column is a series of cells going vertically or up and down the table. • You should tell where a particular piece of data is by describing the row and column.
Examples FAVORITE PETS OF STUDENTS This sort of table lends itself to a bar or column graph as the information is a one time response. A circle graph could also be used.
Favorite Student Weekend Activity A bar or column graph would be an excellent illustration of this data as it is a one time survey of the student population.
Average Daily Temperature for February 1-5 in Degrees Fahrenheit This sort of data table lends itself well to a line graph as the temperature is a continuous item that fluctuates.
Percent of Hours in a Day Spent on Activities This sort of table's data would be well illustrated by a circle or pie graph as it show the parts of a whole - in this case hours of a day and how they were spent.
Bar Graphs Bar graphs are an excellent way to show results that are one time events, especially samplings such as surveys, inventories, etc. Favorite Student Weekend Activity Notice that in this graph each row is labeled.
Column Graphs Column graphs are similar to bar graphs. Both have grid lines going horizontally and vertically. The column graph is also used for one time or single events rather than continuous events. FAVORITE PETS OF STUDENTS In the column graph the data is presented in columns. The category names can be on the graph or underneath the column. It is not necessary to assign different colors to the columns although you could do so and then attach a legend that would explain the different colors and which category they stood for.
Line Graphs This line graph shows the degrees of temperature going up the vertical axis and the days of the week on the horizontal axis. The points for the temperature for each day are connected by a line. Line graphs should show a change over a period of time or a comparison such as speed. A line graph is useful in displaying data that changes continuously over time. The example below shows the changes in the temperature over a week in February.
Circle Graph A circle graphs is used when the data can be expressed as percentages of a whole. The entire circle shown in a pie graph is equal to 100% of the data. The graph is divided as a baker's pie would be into slices that represent the proportional amounts of time spent on each activity. To the right of the pie chart is a legend that tells which color stands for which category. In addition, the percents are also near the pie slice that stands for that particular amount of time spent.
Your Turn to Create Use the information on the next page to create each of the following items: • A data table of letter grades, number of students, average number of hours the students studied and the percentage of students receiving each letter grade (A-F) • A bar graph of student grades and the number of students in the class. • A line graph showing the student’s grades and the number of hours they studied • A circle graph showing the percentage of students in the class that earned each letter grade. Note: Don’t forget to add a title for each graph and to labeled the axis'.
Data Table • Create a data table of letter grades, number of students, average number of hours the students studied and the percentage of students receiving each letter grade (A-F)
Bar Graph Create a bar graph of student grades and the number of students in the class. 8 6 4 2 0 # of Grades A B C D F Grade
Create a line graph showing the student’s grades and the number of hours they studied Line Graph Student’s Grades by Average # of Hours Studied A B C D F G R A D E 0 1 2 3 4 5 6 7 8 9 10 11 12 13 14 15
Create a circle graph showing the percentage of students in the class that earned each letter grade. Circle Graph Percentage of Student Grades Earned
Writing a Conclusion The conclusion must be written in paragraph form. The 1st paragraph should tell if the hypothesis was right or wrong. If the hypothesis was wrong tell why. Likewise if it was right give data to show that is was right. The 2nd paragraph should identify the independent variable, constant variables and the variables that could not be controlled. The 3rd paragraph should list at least two experimental extensions that could be done in the future. The 4th paragraph should explain at least two concepts learned from the experiment.
Sample Experimental/Lab Write-Up Problem:How many times will the top pop off a film canister using water and Alka-Seltzer? Research: When water and Alka-Seltzer come in contact with one another, they undergo a chemical reaction in which CO2 gas is released. When this gas is contained in a film canister, it will blow the top off. Hypothesis: If water and Alka-Seltzer are combined to see how many times the top will blow off a film canister, then it will be 6 times.
Materials: 1. 1 film canister with a tight fitting lid 2. 200 ml or water 3. 3-5 Alka-Seltzer tablets 4. paper towels 5. tape 6. a partner
Procedure: • Tape 1 Alka-Seltzer under the top of the film canister. • Fill the canister ½ full of water. • Tightly place the top on the film canister. • Hold the top and bottom, shake up and down for 10 seconds • Release the top. • Have your partner retrieve the top and put ot back on the film canister. • Repeat steps 4-6 until all the Alka-Seltzer and gas is used. (You may refill the canister with water at any time.) • Use the paper towels to dry off the canister before taping another Alka-Seltzer to the lid. • Repeat the experiment at least 3 times; record the number of pops for each trial.
Data: Top Pops
A Sample Conclusion The hypothesis was not correct because it said the top would pop off 6 times and it did not. It popped off 3 times in the first test, 5 times in the second test, and 10 times in the third test. However the average calculated for the three test is 6 times. The variable being test was the number of times the top would pop off of the canister. He constant variables in this experiment were the type of canister used, the amount of water added, the amount of Alka-Seltzer used, the amount of time the canister was shaken. The variables that could not be controlled were how high the top flew, how far the top flew, how long it took to retrieve the top, how much water came out with the gas, and if the alka-Seltzer flew out with the gas. These variables could not be controlled because they all depended on the amount of gas building up inside the canister.
A few extensions of this experiment, or examples of what could have been done differently, are to use baking soda and vinegar instead of water and Alka-Seltzer, or to combine all of these ingredients at once. Instead of the number of pops a test could have been done to see how high or how far the top popped off. In addition, more Alka-Seltzer and more water could have been used with each test. One concept gained from this experiment was the chemical reaction produced by the water and Alka-Seltzer. Another concept learned was that the production of bubbles indicates that a gas is present. Finally it was noted that this type of chemical reaction can be dangerous if the top is pointed toward someone when released.
A Few Final Notes • All experiments should be testable – not a research paper, a survey, demonstration, or model. • A minimum of five different test should be performed to get accurate results. • Some experiments allow you to use controls. Such an experiment uses a separate group to compare with your test group. For example, if you test to see if fertilizer affects plants, then you should have a control experiment that is not subject to any fertilizer but is otherwise identical to your experimental group in every way. If you use a control, it should be discussed it in the second paragraph of the conclusion.