Download
1 / 19
190 likes | 370 Views
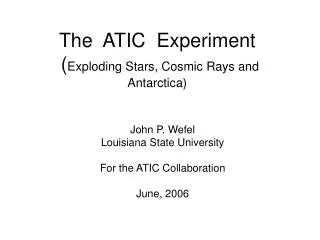
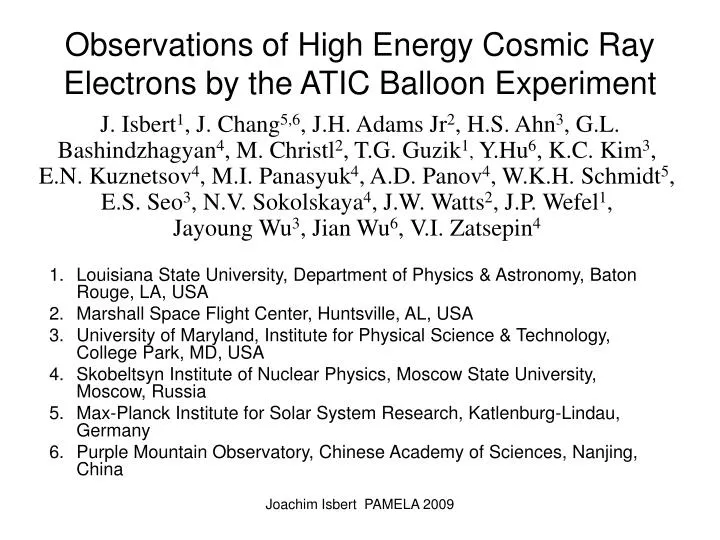
Observations of High Energy Cosmic Ray Electrons by the ATIC Balloon Experiment.

E N D
Observations of High Energy Cosmic Ray Electrons by the ATIC Balloon Experiment J. Isbert1, J. Chang5,6, J.H. Adams Jr2, H.S. Ahn3, G.L. Bashindzhagyan4, M. Christl2, T.G. Guzik1, Y.Hu6, K.C. Kim3, E.N. Kuznetsov4, M.I. Panasyuk4, A.D. Panov4, W.K.H. Schmidt5, E.S. Seo3, N.V. Sokolskaya4, J.W. Watts2, J.P. Wefel1, Jayoung Wu3, Jian Wu6, V.I. Zatsepin4 • Louisiana State University, Department of Physics & Astronomy, Baton Rouge, LA, USA • Marshall Space Flight Center, Huntsville, AL, USA • University of Maryland, Institute for Physical Science & Technology, College Park, MD, USA • Skobeltsyn Institute of Nuclear Physics, Moscow State University, Moscow, Russia • Max-Planck Institute for Solar System Research, Katlenburg-Lindau, Germany • Purple Mountain Observatory, Chinese Academy of Sciences, Nanjing, China Joachim Isbert PAMELA 2009
Cosmic Ray Research: Determines Composition and Energy of Cosmic Rays to understand the “Cosmic Accelerator”. Method: Measure Cosmic ray composition and spectrum and propagate back to source composition Potential Source candidates:Super Novas, Super Nova Remnants, Pulsars, Microquasars, Dark matter decay?, ….. Color-composite image of E0102-72.3: Radio from ATCA; X-ray from Chandra and Visible from HST. HESS image of RX J1713.7-3946 TeV gamma rays Joachim Isbert PAMELA 2009
The ATIC Instrument 2280 Si matrix pixels 3 XY planes plastic scintillator BGO calorimeter, ATIC 1+2,18.4 rl, in 4 XY, planes, ATIC 4,22.9 rl, in 5 XY planes, Graphite (carbon) target Joachim Isbert PAMELA 2009
ATIC was constructed as a balloon payload Joachim Isbert PAMELA 2009
ATIC-2 Science Flight from McMurdo - 2002 • 65 Gbytes Recorded Data • 16,900,000 Cosmic Ray events • High Energy Trigger > 75 GeV for protons • >96% Live-time • Internal pressure (~8 psi) decreased slightly (~0.7 psi) for 1st 10 days then held constant • Internal Temperature: 12 – 22 C • Altitude: 36.5 1.5 km • Launch: 12/29/02 04:59 UTC • Begin Science: 12/30/02 05:40 UTC • End Science: 01/18/03 01:32 UTC • Termination: 01/18/03 02:01 UTC • Recovery: 01/28/03; 01/30/03 Joachim Isbert PAMELA 2009
Recovery expeditions to the plateau The good ATIC-1 landing (left) and the not so good landings of ATIC-2 (middle) and ATIC-4 (right) ATIC is designed to be disassembled in the field and recovered with Twin Otters. Two recovery flights are necessary to return all the ATIC components. Pictures show recovery flight of ATIC-4 Joachim Isbert PAMELA 2009
How are electrons measured? • Silicon matrix identifies charge • Calorimeter measures energy, resolution= 2%, Key for identifying spectral features • Key issue: Separating protons and electrons • Use interactions in the target • 78% of electrons and 53% of protons interact • Energy deposited in the calorimeter helps: • Electrons 85%; Protons 35% Ep = 2.4XEe • Reduces proton flux by X0.23 • Combined reduction is X0.15, then • Examine shower longitudinal and transverse profile Joachim Isbert PAMELA 2009
p,e,γ Shower image in ATIC (from Flight data) Energy deposit in BGO ~ 250 GeV Electron and gamma-ray showers are narrower than proton showers Gamma shower: No signal in the Si matrix detectors around shower axis Proton electron gamma Joachim Isbert PAMELA 2009
Parameters for Shower analysis • RMS shower width in each BGO layer • Weighted fraction of energy deposited in each BGO layer in the calorimeter Joachim Isbert PAMELA 2009
Instrument calibrations at CERN used to verify the Instrument performanceandvalidate Simulations • Used CERN instrument calibration with 150 GeV electrons and 375 GeV protons to validate electron analysis and evaluate the proton contamination. • CERN data also used to investigate instrument response, energy resolution & check simulations Joachim Isbert PAMELA 2009
The method to select electron events: • Rebuild the shower image, get the shower axis, and get the charge from the Si-matrix detector: • 0.8<Z<1.6, E>50GeV, χ2<1.5, • good geometry • 2. Shower axis analysis • Reject Protons which have their first interaction point in carbon • 3. Shower width analysis: • Cut F values for BGO1, BGO2and BGO7, BGO8 After step 1 After step 2 After step 3 Joachim Isbert PAMELA 2009
Atmospheric Gamma-rays:Test of the electron selection method Reject all but 1 in 5000 protons Retain 85% of all electrons Plus: ATIC Diamond: Emulsion chamber Joachim Isbert PAMELA 2009
The ATIC electron results exhibits a “feature” • Sum of data from both ATIC 1 and ATIC 2 flights • Curves are from GALPROP diffusion propagation simulation • Solid curve is local interstellar space • Dashed curve is with solar modulation • Spectral index is -3.23 for below ~ 100 GeV • “Feature” at about 300 – 800 GeV • Significance is about 3.8 sigma • Also seen by PPB-BETS • Emulsion chamber data is currently being re-analyzed ATIC 1+2, Alpha Magnetic Spectrometer, HEAT magnetic spectrometer, BETS, PPB-BETS, Emulsion chambers Joachim Isbert PAMELA 2009
ATIC4 Preliminary Preliminary ATIC 1 ATIC 2 ATIC 4 ATIC 1+2+4 ATIC 1+2 ATIC1+2 Preliminary All three ATIC flights are consistent “Source on/source off” significance of bump for ATIC1+2 is about 3.8 sigma ATIC-4 with 10 BGO layers has improved e , p separation. (~4x lower background) “Bump” is seen in all three flights. Significance for ATIC1+2+4 is 5.1 sigma Joachim Isbert PAMELA 2009
ATIC and FERMI - ATIC or FERMI ?? Both agree below ~100 GeV Both show excess above E^-3.2 index at high E But different in shape Joachim Isbert PAMELA 2009
The effect of background subtraction • Background includes secondary e-as well as misidentified protons and secondary gamma rays. • Secondary e-, from well established calculations (e.g. Nishimura et al., 1980) • Proton contamination was studied using CERN data, by analyzing flight secondary and from simulations. • Assume proton background is 4 times higher than estimated • Electron spectrum is lower but still consistent with HEAT and AMS. • Spectrum for energies < 250 GeV is steeper. • Feature at 300 GeV to 800 GeV is still present but larger error bars at high energy edge. Joachim Isbert PAMELA 2009
The effect of the energy resolution on the feature • The ATIC 22 Xo BGO calorimeter essentially fully contains the electron shower and provides an energy resolution of a few %. • A spectrum with an index of -3.1 up to 1 TeV followed by a softer spectrum of index -4.5 • Add a power law spectrum component with an index of -1.5 and a cutoff at 620 GeV • Reduce energy resolution to 15%. Features are broadened, peak value is decreased and spectrum appears to have an index of ~-2.9 • Reduce energy resolution to 25%. Features are almost “flattened” and spectrum appears to have an index of ~-3.0 Joachim Isbert PAMELA 2009
Conclusions (1) • The ATIC data are determined with high energy resolution and high background rejection, relying mostly on direct measurements and a minimum simulations. • The FERMI data points are determined with very high statistics but lower energy resolution. • The ATIC, FERMI, PAMELA, AMS and HEAT data agree below 100 GeV and show a spectral index of ~E^-3.2. • Both ATIC and FERMI show excess electrons at high energies with reference to the E^-3.2 spectral index. • Both the ATIC and FERMI excesses are in agreement when the broadening due to the lower energy resolution in FERMI is taken into account. • The ATIC, PAMELA and FERMI results can probably be explained by astrophysical sources (i.e. pulsars,…) or from dark matter annihilation or a combination thereof. Joachim Isbert PAMELA 2009
Conclusions (2) • Consequences of the ATIC – FERMI discussion: • Increased requirements on MC simulation accuracy • Comparison of model calculations with measured spectra need to take • quality of data points into account (i.e. energy resolution,….) • - More critical parameters should be measured in instruments • Future instruments should be designed for high resolution • and high statistics Joachim Isbert PAMELA 2009