Download
1 / 49
840 likes | 1.76k Views
Electrical Methods. Resistivity Surveying. Chapter 12. Geologic Resistivity 101. 1. Resistivity surveying investigates variations of electrical resistance, by causing an electrical current to flow through the subsurface using wires (electrodes) connected to the ground.

E N D
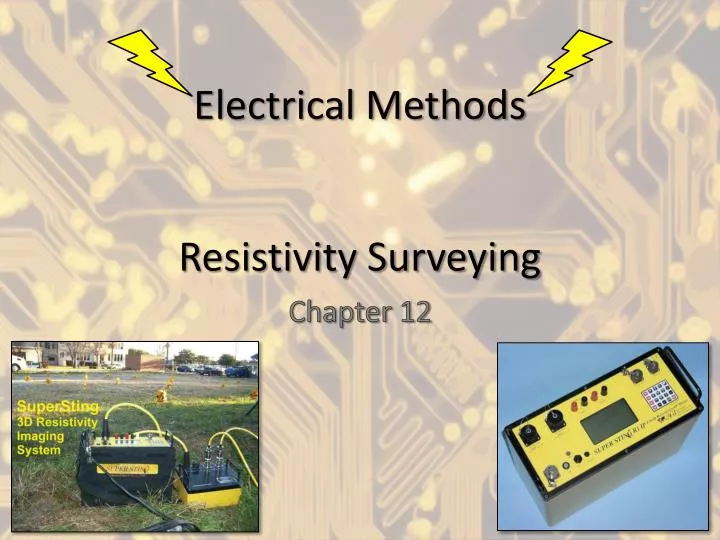
Electrical Methods Resistivity Surveying Chapter 12
Geologic Resistivity 101 1 • Resistivity surveying investigates variations of electrical resistance, by causing an electrical current to flow through the subsurface using wires (electrodes) connected to the ground. • Resistivity = 1 / Conductivity But what exactly is “Resistivity?”… A multi electrode resistivity survey A close-up of an electrode
Resistance, Voltage, & Current • An analogy… • To get water to circulate through the system below… • Must provide a push • Electricity is acts in a similar way… • To get current to flow you must provide a push… • The “push” is called a potential difference or voltage • Symbol: p.d. V or ΔV (V [=] volts) • The “flow” is called the current • Symbol: I (I = amperes / amps
Resistance, Voltage, & Current • The amount of potential difference required to push a given current is directly proportional to the “Resistance” • Ohm’s Law: • Resistance [=] Ohms (symbol = Ω) • But this chapter is about resistivity, not resistance… • Resistance, R ≠ Resistivity, ρ (rho) • They are related, but are fundamentally different things… How do we measure resistance? Why does this work? Slope = Resistance
Resistivity…Finally • Resistance depends on: • The material properties • i.e. the resistivity, ρ (so, yes, ρ is a material property!) • The shape of the material that has current flowing through it. • R = Resistance, a= cross sectional area, l = length • Therefore… • Resistance is higher when current is forced through a: • Small area • Long length Or…
Resistivity…How Do We Measure It? • So, now, you can probably figure out how we measure the resistivity of a material • Apply a known potential difference (measured with voltmeter) to a circuit with a resistive material of known length and cross-sectional area. • Then measure the current (with ammeter) • This gives the resistance, R • Use the length and cross sectional area to calculate ρ But wait! Doesn’t adding these devices to the circuit change the overall resistance?
Resistors in Series • A “series” circuit has more than one resistor in series (one after the other) • Series: all current must travel the same path • Two or more resistors in series behave like one resistor with an equivalent resistance, Req of… Or in general… This rule does not apply to all electrical devices. E.g., capacitors are different
Resistors in Parallel • Parallel circuit: The current can take multiple paths • A “parallel” circuit has more than one resistor in parallel (the current is split among the Rs) Or in general…
Measuring Resistivity • Voltage is measured by a voltmeter • Plugged in parallel with the R of interest • Hi R value • Current is measured by an ammeter • Plugged in series along the branch of the circuit shared by the R of interest • Low R value So, the ammeter and voltmeter do not have an effect on the circuit’s resistance
Resistivity of Geologic Materials • The resistivity of the subsurface depends upon: • The presence of certain metallic ores • Especially metallic ores • The temperature of the subsurface • Geothermal energy! • The presence of archeological features • Graves, fire pits, post holes, etc… • Amount of groundwater present • Amount of dissolved salts • Presence of contaminants • % Porosity and Permeability A resistivity profile
Atomic Charge? • Recall that matter is conceptualized as being made of atoms: • + charged nucleus (protons + neutrons) • - charged electrons circle the nucleus in a cloud pattern • Usually these charges are balanced • E.g. H2O, NaCl, KAl2Si2O8, (Mg,Fe)2SiO4 • An imbalance in charge (i.e. ions), gives a body a net charge. • SO42-, O2- • Resistivity is concerned with the FLOW of charge, not the net charge or any imbalance in charges
Types of Conduction • Conduction refers to the flow of electricity (or other types of energy) • For electric conduction: Three basic flavors • Electrolytic / Ionic • Slow movement of ions in fluid • Electronic • Metals allow electrons to flow freely • Di-electric • Electrons shift slightly during induction • We won’t cover this
Conduction in the Earth • In rocks, two basic types of conduction occur • Electronic: Electrons are mobile in metallic ores and flow freely • Metals (wires) and some ore bodies • Electrolytic / Ionic: Salts disassociate into ions in solution and move • Involves motion of cations (+) and anions (-) in opposite directions
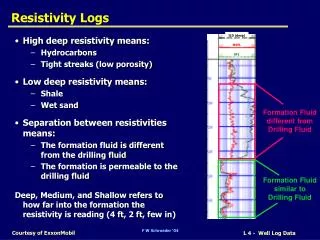
Archie’s Law • Porous, water-bearing rocks / sediments may be ionic conductors. Their “formation resistivity” is defined by Archie’s Law: • Archie’s law is an empirical model • Note the exponents…what does this imply about the range of resistivity of geologic materials?
Rock & Mineral Resistivities • Largest range of values for all physical properties. • Native Silver = 1.6 x 10⁻⁸ Ohm-m (Least Resistive) • Pure Sulphur = 1016 Ohm-m (Most Resistive)
General Rules of Thumb For Resistivity Highest R Lowest R Igneous Rocks Why? Only a minor component of pore water Metamorphic Rocks Why? Hydrous minerals and fabrics Sedimentary Rocks Why? Abundant pore space and fluids Clay: super low resistivity
General Rules of Thumb For Resistivity Highest R Lowest R Older Rocks Why? More time to fill in fractures and pore space Younger Rocks Why? Abundant fractures and/or pore space
Subsurface Current Paths • About 70% of the current applied by two electrodes at the surface stays within a depth equal to the separation of the electrodes • Typically your electrode spacing is 2x your target depth • But this depends on array type (we’ll cover this later)
Subsurface Current Paths • Why does electricity spread out and follow a curved path in the subsurface? • A thin layer has a large resistance • Electricity follows the path or area of least resistance
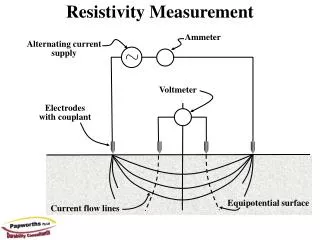
A Typical Resistivity Meter • A resistivity meter consists of both a voltmeter and a current meter (ammeter). • Most systems report the ratio V/I instead of each one separately • Gives the resistance • The resistance can then be converted into resistivity using geometrical parameters based on the type of array. (We’ll come back to this…) A resistivity meter is basically a current meter and voltmeter all in one
How Many Electrodes? • Most modern resistivity systems typically utilize at least four electrodes • Large (and unknown) contact resistance between the electrode and the ground could otherwise give inaccurate readings. • To understand why four electrodes are better than two, lets look at the circuit setup…
A Circuit Model Note: the Voltmeter has an ~infinite resistance so we can add 2Rc to it without error (eliminate each Rc on the right branch). This leaves us with R=V/I
Typical Resistivity Stats • The applied voltage (to the current electrodes) is ~100 V • ΔV (at the potential electrodes) ≈ millivolts---> a few volts • Current: milliamps or less • So you can get a shock, but it is not dangerous • Current flow is reversed a few times per second to prevent ion buildup at electrodes
Vertical Electrical Sounding • Resistivity surveys do not usually seek to determine the resistivity of some uniform rock • They seek to determine the “apparent resistivity” of several ~horizontal layers with different resistivities • Also called “VES”, depth sounding, or electrical drilling • The essence of VES is to expand electrodes from a fixed center • I.e. to increase at least some of the electrode spacings • Larger spacings cause electricity to penetrate deeper into the ground • To understand VES, lets look at some current paths…
Vertical Electrical Sounding • When electrode spacing is small compared to the layer thickness… • Nearly all current will flow through the upper layer • The resistivities of the lower layers have negligible effect • The measured apparent resistivity is the resistivity of the upper layer But what happens when a flowing current encounters a layer with a different resistivity? Refraction!!
Current Refraction • Current Refracts towards the normal when going into a layer with greater resistivity • Not the same as Snell’s Law! • This is opposite behavior from seismic refraction (unless you think in terms of a conductivity change) • The relationship is:
Current Refraction • Because refraction changes the distribution of current in a layered subsurface • The ratio of V/I changes • We can therefore measure changes in resistivity with depth Uniform subsurface Layered subsurface
Apparent Resistivity • In a VES survey the ratio V/I is measured with increasing electrode spacing… • The ratio changes for two reasons: • Layers of differing resistivity are encountered • The electrodes are now farther apart • Causes measured resistance to decrease! • To determine #1, we must first correct for #2
Apparent Resistivity • Current diverges at one electrode and converges at the other. • Current flow lines trace out a banana-like shape. • Recall that R is directly proportional to length and inversely proportional to cross sectional area. • At depth 2d: • The length of the path is doubled. • The cross sectional length is doubled in both dimensions, so area is 4x. • The measured resistance (V/I) will be ½ as much.
Apparent Resistivity • To account for the effects of changes in electrode spacing, the apparent resistivity is found as: • Here, α is a “geometrical factor” • equal to a/l for a rod (see previous slides) • The geometrical factor varies depending on array configuration / type • I’ll show some common array types later • For reasons that you will soon see, apparent resistivity , ρa, is what is typically used
Wenner Arrays • Pronounced “Venner”. This is the most commonly used in the U.S. • All four electrodes are equally spaced. Spacing = a • Geometrical correction factor = 2πa • Measure resistance (V/I) • Calculate apparent resistivity • Repeat for a range of spacings
Wenner VES Survey • Two measuring tapes are laid out • Spacing is increased progressively • 0.1, 0.15, 0.2, 0.3, 0.4, 0.6, 0.8, 1, 1.5, 2, 3, 4, 6 etc…see book (pg 188) • The survey is stopped when a desired depth is reached • Depth ≈ ½ outer electrode distance • To be efficient, many people are needed • Modern systems use lots of electrodes • Computer does switching • Mimics various array types (Gives nearly constant spacing in Log space)
Wenner VES Survey • Results of ρa are plotted as log10 ρa versus log10a • Use logs to help accommodate the large range in values For a simple two layer scenario: (multiple layers are more complex) • The first few spacings: • Electrical current mostly flows in the upper layer • so the apparent resistivity is the actual resistivity of the upper layer • At spacings that are large compared to layer 1’s thickness: • Most of the length that the current travels is in the lower layer • So the apparent resistivity is the resistivity of the lower layer How do we determine layer thickness?
Wenner VES Survey • To determine layer thickness • Note that the left curve reaches the lower layer’s resistivity sooner • So, all other factors equal, the first layer must be thinner • In practice, determining thickness is not so easy because how quickly you reach the lower layer’s resistivity also depends on the resistivity contrast • Large resistivity contrasts have a similar effect to thinner layers and vice versa. • Resistivities and thicknesses are instead best found by using “Master curves” that are calculated for different values of thickness and resistivity
Wenner Array Master Curves: 2-Layer Case • To reduce the number of graphs needed, master curves are normalized on both axes. Plotted in Log-Log space • Overlay your data on a master curve and find the curve that matches Both plots MUST BE THE SAME SCALE! I.e. a change in log of 1 on each data axis must match the master curve’s change of 1 log on each axis ρa= calculated apparent resistivity ρ1= resistivity of top layer a = electrode separation h = thickness of top layer
Master Curve: 2-Layer Example • To determine the resistivities of a two layer system: • Make a plot of log10 a (electrode spacing) vs. log10ρa (apparent / measured resistivity) • Scale the plots to be the same size • So a log10 change of 1 on your graph is the same size as the master curve • Slide your data around until you find a curve that it best matches • Find the a/h1 line on the master curve. Where this crosses your data’s x-axis is the layer thickness. • Find the ρa /ρ1 line on the master curve. Where this crosses your data’s y-axis is the resistivity of the first layer. • The resistivity of the second layer can be found by multiplying the first layer’s resistivity by the best-fitting curve’s ρa /ρ1 ratio Illustrator Demo
Master Curve: 2-Layer Example • So for this data: • The data best fit the ρa /ρ1 =6 master curve • h1 = 0.2 m • ρ1 = 18.9 ohm-m • ρ2 = 18.9*6 = 113 ohm-m
Multiple Layers • If there are more than two layers: • The plot probably never reaches the resistivity of layer 2 even at large separations. • Increasing spacing penetrates into layer 3. • Visual inspection can tell how many layers are present. • Each kink or curvature change shows the presence of a new layer • But this is only a minimum. Some layers may lack large and visible contrasts.
Multiple Layers • If there are more than two layers: • The thicknesses and resistivities of each layer are modeled using computer programs. • The program guesses at the number of layers and makes a theoretical plot • Parameters are changed until a satisfactory fit is achieved.
Other Array Types • Lots of other resistivity arrays exist. • Schlumberger is commonly used (especially in Europe) • Only C electrodes are moved • Saves time! • Eventually ΔV becomes small • P electrodes are moved and then process is repeated • Each has its own set of master curves and software
The BGS Offset Wenner Array System • Multi-electrode arrays are now commonly used. • A computer-controlled switch box turns electrodes on-off • Can get a lateral and vertical data in one step • Can also assess error and lateral variations.
VES Limitations • Maximum depth of detection depends on: • Electrode spacing (rule of thumb depth = ½ C electrode spacing) • Resistivity contrasts between layers • Limits of detection of small ΔV • Low-resistivity layers result in ΔV becoming very small • Large spacings cause ΔV to become small • Layers may have spatially-variable resistivities • If so, electrical profiling may be a better choice • If not, you can interpolate lateral continuity
VES Limitations • Layers may have anisotropic resistivity • Resistivity may be much greater perpendicular to layering • e.g. bedding, laminations, foliation • Horizontal laminations cause layer thicknesses to be overestimated • Sandwiched thin layers produce non-unique results due to refraction • If middle unit has much higher resistivity • tp is constanct, so a 2x thicker unit with ½ resistivity would produce the same results. • If middle unit has much lower resistivity • t/p is constant, so a 2x thicker layer with 2x resistivity would produce the same results • Called ‘equivalence’
Electrical Profiling • Lateral changes in resistivity can be effectively mapped using electrical profiling. • Can use similar arrays to VES • Patterns vary depending on what array is used • Patterns are complicated because electrodes may be in zones of different properties.
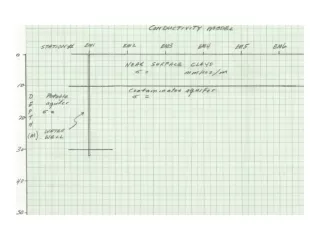
Electrical Imaging • Because resistivity may vary both laterally and vertically, neither VES or electrical profiling may give the desired results. • To image lateral and vertical changes, electrical imaging is used • Involves expanding and moving arrays • produces a pseudosection • pseudosections do not reveal the actual properties, but do show useful patterns
Pseudosection ---> True Section • With the aide of computers pseudosections can be converted into approximately ‘true sections’ Caveats: • edges are blurred • actual contrasts are underestimated
Final Remarks • Like all geophysical techniques resistivity: • Produces non-unique results • Data should be compared to known geological data (e.g. boreholes) • Similar rocks have a wide range in resistivities depending on water content • Lithology changes do not necessarily correspond to a resistivity change • Resistivity changes to not necessarily correspond to a lithology change • So, without sound geological knowledge, resistivity data may be misleading.