Download
1 / 4
40 likes | 168 Views
Supplemental Information MICROGLIA CONVERT AGGREGATED AMYLOID- b INTO NEUROTOXIC FORMS THROUGH THE SHEDDING OF MICROVESICLES

E N D
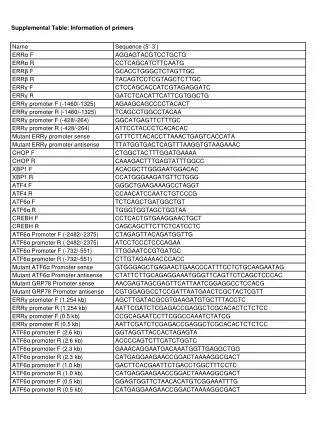
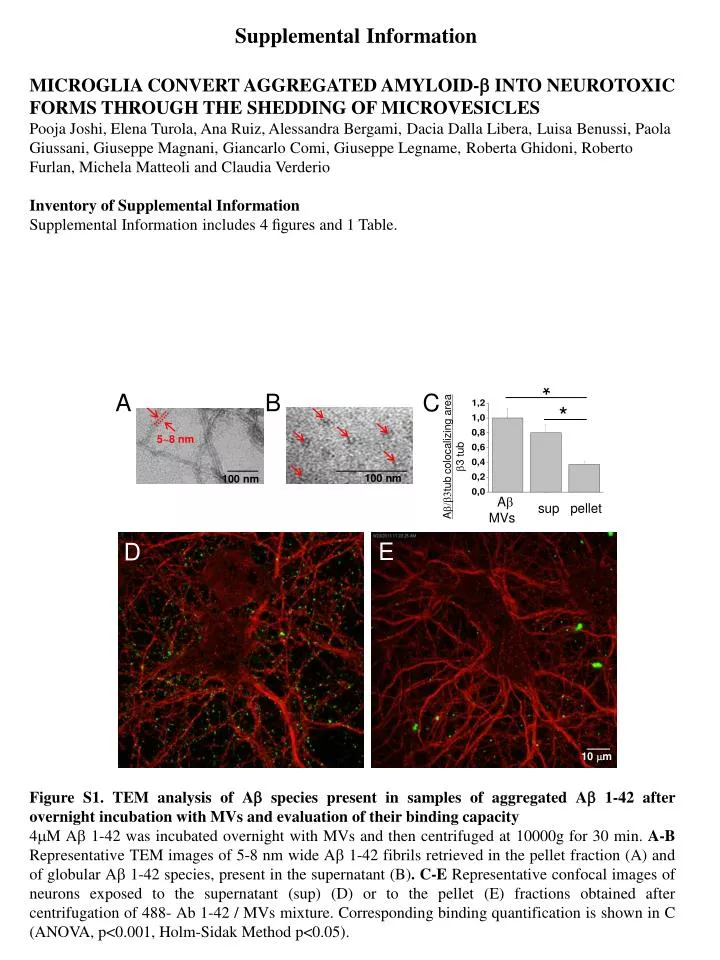
Supplemental Information MICROGLIA CONVERT AGGREGATED AMYLOID-b INTO NEUROTOXIC FORMS THROUGH THE SHEDDING OF MICROVESICLES Pooja Joshi, Elena Turola, Ana Ruiz, Alessandra Bergami, Dacia Dalla Libera, Luisa Benussi, Paola Giussani, Giuseppe Magnani, Giancarlo Comi, Giuseppe Legname, Roberta Ghidoni, Roberto Furlan, Michela Matteoli and Claudia Verderio Inventory of Supplemental Information Supplemental Information includes 4 figures and 1 Table. * A B C * 5~8 nm Ab/b3tub colocalizing area b3 tub 100 nm 100 nm Ab MVs sup pellet E D 10 mm Figure S1. TEM analysis of Ab species present in samples of aggregated Ab 1-42 after overnight incubation with MVs and evaluation of their binding capacity 4mM Ab 1-42 was incubated overnight with MVs and then centrifuged at 10000g for 30 min. A-B RepresentativeTEMimages of 5-8 nm wide Ab 1-42 fibrils retrieved in the pellet fraction (A) and of globular Ab 1-42 species, present in the supernatant (B).C-E Representative confocal images of neurons exposed to the supernatant (sup) (D) or to the pellet (E) fractions obtained after centrifugation of 488- Ab 1-42 / MVs mixture. Corresponding binding quantification is shown in C (ANOVA, p<0.001, Holm-Sidak Method p<0.05).
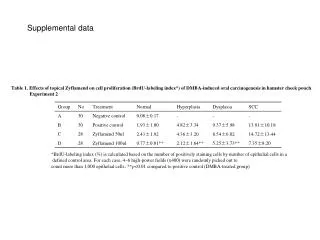
50 Thioflavin-T Ab 40 Ab-MVs ------- Figure S2. Thioflavin T emission spectra of aggregated Ab 1-42 (solid blue line), incubated overnight with MVs (dashed blue line) or acutely exposed to MVs No changes were detected in Thioflavin-T spectra upon addition of MVs just before mixing Thioflavin-T with samples of aggregated Ab 1-42. Aβ-MVs(AA) 30 20 10 540 525 510 495 465 480 MW MVs exos P2 P3 P4 P2 P3 P4 25 KD 20 KD 4 KD 34 30 75 (mg) 50 KD Tsg101 Alix 90 KD Alix 68 60 150 (mg) Figure S3. Western Blot of Ab species in MVs produced from Ab-preloaded microglia. Relates to figure 4 Western blot analysis of Ab 1-42 species present in shed MVs (P2 and P3 fractions) and exosomes (P4 fraction) constitutively produced during 24 h by 4X106 microglia pre-exposed to biotinylated Ab 1-42 (4mM).The blot was carried out using a 15% Tris-glycine gel and the membrane was probed with streptavidine. Shed MVs and exosomes produced by 8X10⁶ donor microglia were probed in parallel for the EMV markers Tsg101 and the exosomal marker Alix (lower panel). Numbers below each lane indicate the estimated amount of loaded proteins.
Aβ 1-40 Aβ 1-38 Aβ 1-39 Aβ 1-42 Aβ 1-37 Aβ 1-18 Figure S4. Mass spectrometry spectra of MVs from an AD patient. Relates to figure 5 Representative SELDI TOF MS spectra of MVs isolated from the CSF of a patient with AD showing the most common Ab peptides captured by immunoproteomic assay employing 6E10 and 4G8 monoclonal antibodies Table S1. Clinical features of MCI and AD patients