Download
1 / 20
250 likes | 353 Views
What is the Greenhouse Effect?. Increases in greenhouse gases will lead to increases in global temperature. Data from 2007 IPCC report. CO 2 Concentration. Av Surface Temp. Sea Level Rise (cm). Climate Change: Faster than expected in 1990s. Solid lines = observed.

E N D
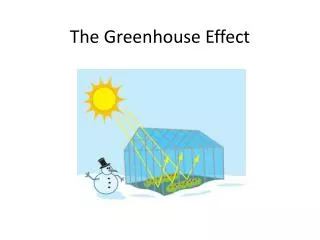
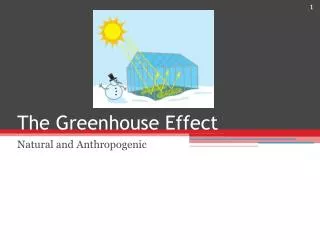
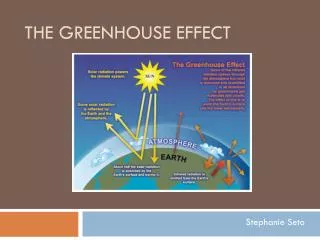
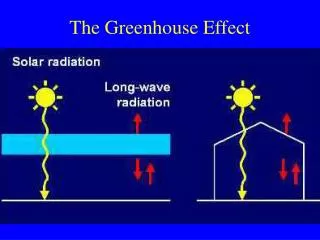
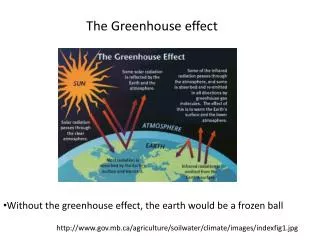
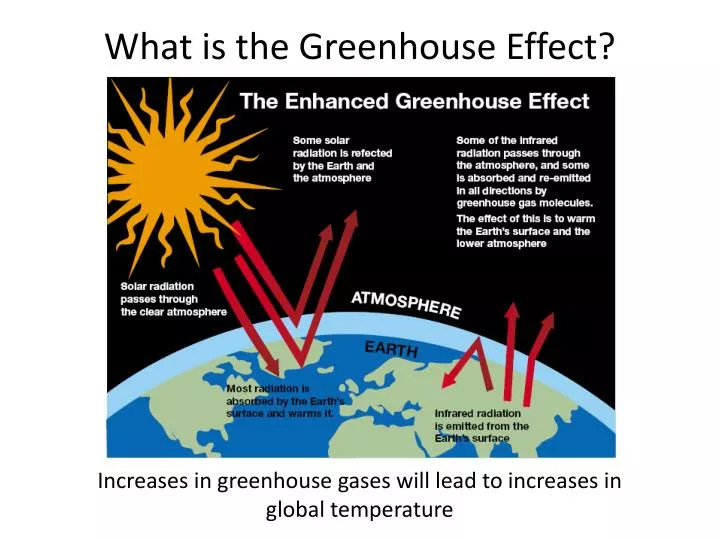
What is the Greenhouse Effect? Increases in greenhouse gases will lead to increases in global temperature
CO2 Concentration Av Surface Temp Sea Level Rise (cm) Climate Change: Faster than expected in 1990s Solid lines = observed • IPCC 4 (2007) was limited to science published by early 2006 • Subsequent research shows increasing rates of: • Global GHG emissions 3.3% in 2000s, vs 1.3% in 1990s • Temperature rise especially in polar regions • Ice melt (Arctic: 40% loss since 1980, accelerating 2006-07) • Sea-level rise Dashed lines = 1990s projections Rahmstorf, Church, et al., Science 2007 1975 1985 1995 2005
IPCC Fourth Assessment Report (2007) was very conservative. Recent studies indicate accelerating change.
What are the Consequences? Melting of glaciers and polar ice Since 1850, glaciers in the European Alps have disappeared from more than 30-40% of their former range
What are the Consequences? Increased temperature and incidence of heat waves Globally averaged, the earth is ~0.75 C warmer than it was in 1860
September 2008 sea ice = 4.67 (ice was thinner so volume was record low)
What are the Consequences? Sea Level Rise
Biological Impacts • Extreme weather events cause rapid range contraction due to physiological tolerances being surpassed. - You can see this in genetics – increase in heat tolerant genotypes seasonally, then decadally in fruitflies • Phenology changes • Abundance and community reassembly processes • Sea level rise - salinization • Ecosystem processes – decomposition, primary productivity, etc.
What are the Consequences? Melting of glaciers and polar ice Polar bears need sea ice – seals and other marine mammals main food item Documented drop in female weight 1980 = 650lbs 2004 = 507 Minimum weight needed to become pregnant Unprecedented numbers swimming and then found drowned.
Global Warming Global coupled atmosphere-ocean-ice model Hoegh-Guildberg (1999)
What are the Consequences? Shifts in species ranges Edith's Checkerspot Butterfly has been disappearing from the lower elevations and southern limits of its range. Average shift = 35 miles north
What are the Consequences? Shifts in biological activity Toads, frogs, and newts spawning early. Spawning was 9 to 10 days earlier over a 17-year period. Marmots are emerging from hibernation on average 23 days earlier than 20 years ago. This coincides with an increase in average May temperatures of about 1.8oF (1oC).