Download
1 / 37
370 likes | 501 Views
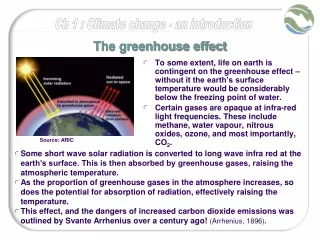
The Greenhouse Effect. SPM 3. Concentration of Carbon Dioxide and Methane Have Risen Greatly Since Pre-Industrial Times. Carbon dioxide: 33% rise. Methane: 100% rise. BW 5. The MetOffice. Hadley Center for Climate Prediction and Research. Variations of the Earth’s surface temperature

E N D
Concentration of Carbon Dioxide and Methane Have Risen Greatly Since Pre-Industrial Times Carbon dioxide: 33% rise Methane: 100% rise BW 5 The MetOffice. Hadley Center for Climate Prediction and Research.
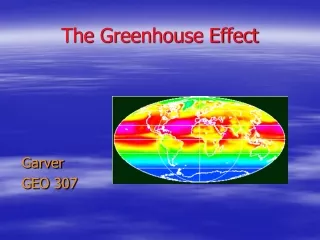
Variations of the Earth’s surface temperature for the past 140 years SPM 1a
Variations of the Earth’s surface temperature for the past 1,000 years SPM 1b
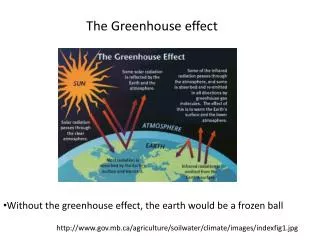
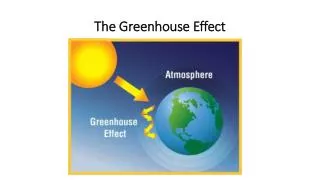
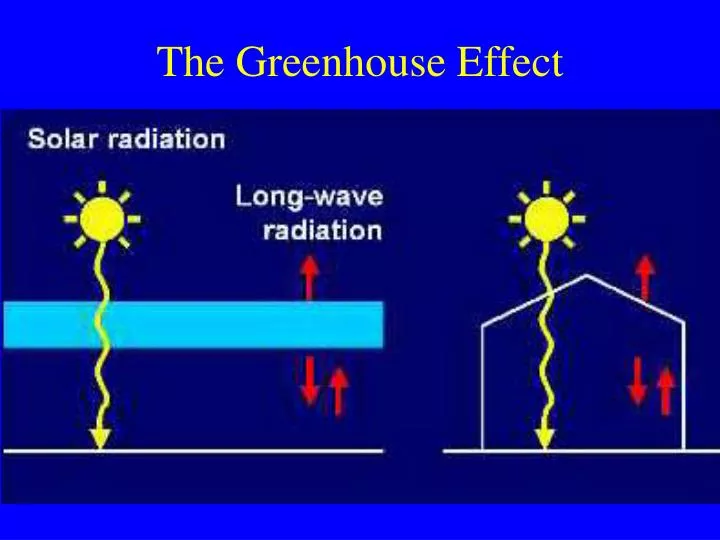
Certainties • Existence of natural greenhouse effect • Greenhouse gases increasing • Temperature increasing • 1998 the hottest in at least 1000 years. • Sea levels rising • 4 -10” over century
Uncertainties • Timing of atmospheric warming, glaciers • The effects of increased cloudiness • Uneven health and ecological impacts • Unanticipated events
People at Risk from a 44 cm sea-level rise by 2080Assuming 1990s Level of Flood Protection Source: R. Nicholls, Middlesex University in the U.K. Meteorological Office. 1997. Climate Change and Its Impacts: A Global Perspective.
Sea-level transgression scenarios for Bangladesh Adapted from Milliman et al. (1989).
Percent of USA with above normal proportion of total annual precipitation from -day extreme events (2” +) BW 7 Karl et al. 1996
Changes in rainfall with doubled CO2 160 Australian 40°N 40°S land 140 points 120 100 Change in 80 frequency 60 (%) 40 20 0 –20 0.2-0.4 0.4-0.8 0.8-1.6 1.6-3.2 3.2-6.4 6.4-12.8 12.8-25.6 >25.6 Daily rainfall class (mm day ) –1
Other impacts • Tropical diseases, insects move north • Loss of agricultural land • End of ecosystems that cannot shift
Future goals? • Reduce CO2 emissions, change economy • World-wide shift to non-fossil energy • Increased energy efficiency
1997 Kyoto Protocol • Cut gases to under 1990 levels by 2012 • China, India exempted for present • Europeans met most goals • U.S. would have to cut energy use 40%; Bush withdrew 2001
Conservation • Homes • insulation, less heat, efficient appliances • Vehicles • Drive less, higher mpg • Industry • Less waste, renewable and efficient energy • Land use • More tress (carbon sinks), no sprawl
Proposal for 2100 energy use • Renewables (solar, wind, hydro) 50% • Biomass 30% (5x present use) • Nuclear phased out • Fossil fuels 18% (down from 80%)
7,000 6,000 5,000 4,000 3,000 2,000 1,000 0 1980 2000 2020 2040 2060 2080 2100 2120 CO2 emissions (1990 -2100) Mtc Year
Global energy websites World Resources Institute www.wri.org World Energy Council www.worldenergy.org/ World Energy Assessment www.undp.org/seed/eap/activities/wea/ UN Development Program www.undp.org/seed/eap/