Download
1 / 1
10 likes | 88 Views
TOWARD A MODEL-BASED SYSTEM OF ESTUARINE CLASSIFICATION D.P. Swaney 1* ,R.W. Howarth 1 , R.M. Marino 1 , D. Scavia 2 , M. Alber 3 and E.W. Boyer 4 1 Dept of Ecology & Evolutionary Biology, Cornell University, Ithaca, NY, 14850

E N D
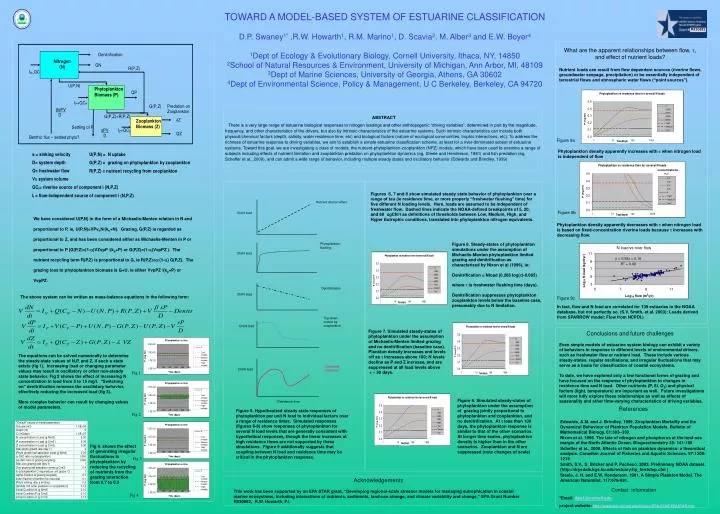
TOWARD A MODEL-BASED SYSTEM OF ESTUARINE CLASSIFICATION D.P. Swaney1* ,R.W. Howarth1, R.M. Marino1, D. Scavia2, M. Alber3 and E.W. Boyer4 1Dept of Ecology & Evolutionary Biology, Cornell University, Ithaca, NY, 14850 2School of Natural Resources & Environment, University of Michigan, Ann Arbor, MI, 48109 3Dept of Marine Sciences, University of Georgia, Athens, GA 30602 4Dept of Environmental Science, Policy & Management, U C Berkeley, Berkeley, CA 94720 Nutrient dilution effect Chl/N load R830882 Phytoplankton flushing Chl/N load Denitrification Chl/N load Top-down control by zooplankton Chl/N load Combined influences Chl/N load Residence time Figure 5. Hypothesized steady state responses of phytoplankton per unit N load to individual factors over a range of residence times. Simulated responses (figures 6-8) show responses of phytoplankton for several N load levels that are generally consistent with hypothetical responses, though the linear increases at high residence times are not supported by these simulations. Figure 9 additionally suggests that coupling between N load and residence time may be critical in the phytoplankton response. • What are the apparent relationships between flow, t, and effect of nutrient loads? Nutrient loads can result from flow dependent sources (riverine flows, groundwater seepage, precipitation) or be essentially independent of terrestrial flows and atmospheric water flows (“point sources”). ABSTRACT There is a very large range of estuarine biological responses to nitrogen loadings and other anthropogenic “driving variables”, determined in part by the magnitude, frequency, and other characteristics of the drivers, but also by intrinsic characteristics of the estuarine systems. Such intrinsic characteristics can include both physical/chemical factors (depth, salinity, water residence time, etc) and biological factors (nature of ecological communities, trophic interactions, etc). To address the richness of estuarine response to driving variables, we aim to establish a simple estuarine classification scheme, at least for a river-dominated subset of estuarine systems. Toward this goal, we are investigating a class of models, the nutrient-phytoplankton-zooplankton (NPZ) models, which have been used to examine a range of subjects including effects of nutrient limitation and zooplankton predation on phytoplankton dynamics (eg, Steele and Henderson, 1981) and fish predation (eg, Scheffer et al., 2000), and can admit a wide range of behavior, including multiple steady states and oscillatory behavior (Edwards and Brindley, 1999) . Figure 9a Phytoplankton density apparently increases with t when nitrogen load is independent of flow concentrations mg/l Figures 6, 7 and 8 show simulated steady state behavior of phytoplankton over a range of tau (ie residence time, or more properly “freshwater flushing” time) for five different N loading levels. Here, loads are assumed to be independent of freshwater flow. Dashed lines indicate the NOAA-defined breakpoints of 5, 20, and 60 ugChl/l as definitions of thresholds between Low, Medium, High, and Hyper Eutrophic conditions, translated into phytoplankton nitrogen equivalents. Figure 9b We have considered U(P,N) in the form of a Michaelis-Menten relation in N and proportional to P, ie, U(P,N)=VPvnN/(kn+N). Grazing, G(P,Z) is regarded as proportional to Z, and has been considered either as Michaelis-Menten in P or proportional to P (G(P,Z)=(1-a)VZvpP /(kp+P) or G(P,Z)=(1-a)VvpPZ ). The nutrient recycling term R(P,Z) is proportional to G, ie R(P,Z)=a/(1-a) G(P,Z). The grazing loss to phytoplankton biomass is G+U, ie either VvpPZ /(kp+P) or VvpPZ. Phytoplankton density apparently decreases with t when nitrogen load is based on fixed-concentration riverine loads because t increases with decreasing flow. Figure 6. Steady-states of phytoplankton simulations under the assumption of Michaelis-Menten phytoplankton limited grazing and denitrification as characterized by Nixon et al (1996), ie: Denitrification = Nload (0.208 log(t)-0.085) where t is freshwater flushing time (days). Denitrification suppresses phytoplankton zooplankton levels below the baseline case, presumably due to N limitation. The above system can be written as mass-balance equations in the following form: Figure 9c In fact, flow and N load are correlated for 139 estuaries in the NOAA database, but not perfectly so. (S.V. Smith, et al. 2003); Loads derived from SPARROW model; Flow from NCPDI.) Figure 7. Simulated steady-states of phytoplankton under the assumption of Michaelis-Menten limited grazing and no denitrification (baseline case). Plankton density increases and levels off as t increases above 100; N levels decline as P and Z increase, and are suppressed at all load levels above t ~ 30 days. • Conclusions and future challenges Even simple models of estuarine system biology can exhibit a variety of behaviors in response to different levels of environmental drivers, such as freshwater flow or nutrient load. These include various steady-states, regular oscillations, and irregular fluctuations that may serve as a basis for classification of coastal ecosystems. To date, we have explored only a few functional forms of grazing and have focused on the response of phytoplankton to changes in residence time and N load. Other nutrients (P, Si, O2) and physical factors (light, temperature) are important as well. Future investigations will more fully explore these relationships as well as effects of seasonality and other time-varying characteristics of driving variables. The equations can be solved numerically to determine the steady-state values of N,P, and Z, if such a state exists (fig 1). Increasing load or changing parameter values may result in oscillatory or other non-steady state behavior. Fig 2 shows the effect of increasing N concentration in load from 5 to 15 mg/l. “Switching on” denitrification removes the oscillatory behavior, effectively reducing the increased load (fig 3). More complex behavior can result by changing values of model parameters. Fig 1 Figure 8. Simulated steady-states of phytoplankton under the assumption of grazing jointly proportional to phytoplankton and zooplankton, and no denitrification. At t less than 100 days, the phytoplankton response is similar to that of the other scenarios. At longer time scales, phytoplankton density is higher than in the other scenarios. Zooplankton and N are suppressed (note changes of scale) References Edwards, A.M. and J. Brindley. 1999. Zooplankton Mortality and the Dynamical Behaviour of Plankton Population Models. Bulletin of Mathematical Biology. 61:303–339. Nixon et al. 1996. The fate of nitrogen and phosphorus at the land-sea margin of the North Atlantic Ocean. Biogoechemistry 35: 141-180 Scheffer et al., 2000. Effects of fish on plankton dynamics: a theoretical analysis. Canadian Journal of Fisheries and Aquatic Sciences. 57:1208-1219 Smith, S.V., S. Bricker and P. Pacheco. 2003. Preliminary NOAA dataset. (http://drysdale.kgs.ku.edu/estuary/hp_firststep.cfm ) Steele, J. H. and E.W. Henderson. 1981. A Simple Plankton Model. The American Naturalist. 117:676-691. Fig 2 Fig 4. shows the effect of generating irregular fluctuations in phytoplankton by reducing the recycling of nutrients from the grazing interaction from 0.7 to 0.3 Fig 3 Acknowledgements This work has been supported by an EPA STAR grant, “Developing regional-scale stressor models for managing eutrophication in coastal marine ecosystems, including interactions of nutrients, sediments, land-use change, and climate variability and change,” EPA Grant Number R830882, R.W. Howarth, P.I. Contact information *Email: dps1@cornell.edu project website: http://www.eeb.cornell.edu/biogeo/EPA-STAR/EPASTAR.htm Fig 4