Download
1 / 20
210 likes | 356 Views
[A Social Network Analysis Suite for Business Intelligence]. Telecom Research & Innovation Centre IBM Research, India. T r iC. SNAzzy. The Setting. In Mobile Telecom markets Competition is ever-increasing New players Lower Average Revenue Per User (ARPU) Customer “ churn ”

E N D
[A Social Network Analysis Suite for Business Intelligence] Telecom Research & Innovation Centre IBM Research, India TriC SNAzzy
The Setting • In Mobile Telecom markets • Competition is ever-increasing • New players • Lower Average Revenue Per User (ARPU) • Customer “churn” • Low barriers to switching providers • Especially in Pre-paid segment • Customer acquisition customer retention • Telecoms must rely on business intelligence • Design the right incentives • Adopt right marketing strategies On the Structure of Massive Telecom Graphs: Findings and Implications
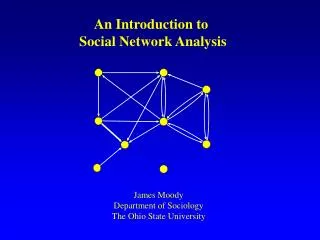
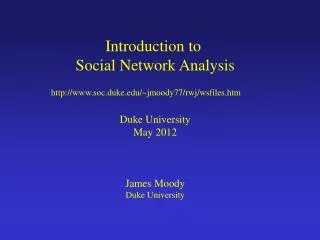
Telescopic view The Setting • Telecom business analytics typically • Analyse only individual customer behaviour • “microscopic view” • Analysing call-graphs • “who-calls-whom” graph • People are the vertices • If two people call each other, there is an edge between their corresponding vertices • How is everyone connected with each other ? • “telescopic view” • May yield major business insights complementaryto traditional mining • Is the graph made up of many small islands ? • High pagerank (social value) can be used in computing customer value On the Structure of Massive Telecom Graphs: Findings and Implications
Data Sources / Preprocessing • The study was done for intra-region calls, and does not include long distance or international calls. • For two of the regions, we collected all the calls made in a week, and for the other two, we collected all the calls made in a month. • Further, very short duration calls (less than 10 seconds) have been ignored as missed calls and wrong calls since they may yield incorrect results. • Multiple calls between any two user or nodes is treated as a single edge. On the Structure of Massive Telecom Graphs: Findings and Implications
Structural Properties • Degree distributions • All parameters quite close • Very few vertices with high in / out degree • Easier to target On the Structure of Massive Telecom Graphs: Findings and Implications
Structural Properties • Degree correlations • Single vertex IN-OUT correlation • Indegree, outdegree correlated upto a point • Beyond that, high outdegree could be salesmen • High indegree micro businesses or highly influential people ? On the Structure of Massive Telecom Graphs: Findings and Implications
124801 266894 755592 Shape of call-graphs • “Bow-Tie” analysis • For all regions, the SCC was much bigger than the IN and OUT regions • For WWW, the sizes are nearly the same • 44 million, 56 million (SCC), 44 million • The “Bow-Tie” model does not fit our graphs • Perhaps, another vertex distribution based model • Instead, we found that an edge distribution based model characterises our graphs better On the Structure of Massive Telecom Graphs: Findings and Implications
SCC Entry Exit Shape of call-graphs Edge induced subgraphs On the Structure of Massive Telecom Graphs: Findings and Implications | CIKM
Shape of call-graphs Instead, we found that an edge distribution based model characterises our graphs better On the Structure of Massive Telecom Graphs: Findings and Implications | CIKM
Shape of call-graphs • Finding the shape can be helpful in many ways • Word-of-mouth advertising might work, since the graph is connected • For a new service rollout, the vertices in the Entry and In-Tunnel zones might qualify as better starting points • This provides another way to segment customers On the Structure of Massive Telecom Graphs: Findings and Implications
Churn Prediction & Analysis SNAzzy constructs an influence propagation model: Given persons who churned (initial churners) Diffuse their influence into their social environment Thus, their friends are at a larger churn risk..(The two C1s churn; N does not, since not enough influence) And this propagates to some of their friends’ friends as well.(C2 affected due to indirect, cumulative influence) Output List of predicted churners Business Value Unique model Captures higher order social effects Capture the effect of multiple churners on a subscriber Does not require profile information. Can be applied in post-paid and pre-paid markets as well. Once the model is created, it can be run quickly and often. Complements traditional churn models. Indirect influence Influence spreading C1 * I I * * N C1 C2 I Initial churners (known) Predicted churners C Telecom Research Innovation Centre Telecom Research Innovation Centre August 29, 2014 11
Churn Prediction & Analysis – SNAzzy Lift • SNAzzy churn model leverages • Usage features: call frequency, call volume, calling neighbors, incoming/outgoing calls etc. • Connectivity features: calls to/from churner neighbors (friends), percentage of churner friends etc. • Interconnectivity features: e.g. fraction of churner friends who are in turn connected between themselves (from real Telecom case study) SNAzzy lift = 5 DT1 – Usage only DT2 – Usage + Connectivity DT3 – Usage + Connectivity + Interconnectivity Telecom Research Innovation Centre
Behaviour of Communities and its Members • Does the behaviour of community members differ from people who do not belong to communities? • Do community members behave differently towards fellow community members than others? • Is the behaviour of community members different in different communities? • How do communities behave collectively?
Does the behaviour of community members differ from people who do not belong to communities? • Community members more active than those who are not community members • Call duration of community members is shorter than for non-community members • But call frequency is much higher, and hence the average talk time is similar
Do community members behave differently towards fellow community members than others? • Community members use SMS more with fellow community members • Call duration of with fellow community members is shorter • But call frequency is much higher, and also the average talk time is much higher
Do people behave differently in different communities? Town Metro • Average call duration is similar across communities • But the SMS and call frequency are very different
SNAzzy Papers • “On the Structural Properties of Massive Telecom Call Graphs: Findings and Implications”ACM CIKM 2006. • “Analyzing the Structure and Evolution of Massive Telecom Graphs”IEEE TKDE, 2008. • “Social Ties and their Relevance to Churn in Mobile Telecom Networks”EDBT, 2008. • “Large Maximal Cliques Enumeration in Large Sparse Graphs”COMAD, 2009. • “Leveraging Social Networks for Corporate Staffing and Expert Recommendation”IBM Systems Journal, 2010. • “Discovery and Analysis of Tight-Knit Communities in Telecom Social Networks”,IBM Journal of R&D, 2010. • "Like-minded Communities: Bringing the Familiarity and Similarity Together”,WISE 2012. • “Viral Marketing for Product Cross-sell through Social Networks”,ECML-PKDD 2012. Telecom Research Innovation Centre
Thank you! IBM Research, India SNAzzy Contact: Natwar Modani (namodani@in.ibm.com) Amit A. Nanavati (namit@in.ibm.com)
Some Terminology • CC: Collection of edges where both ends, that is, the originator and the receiver of the communication, belong to the same community. • CG minus CC: Edges where the originator of the communication belongs to a given community, and the receiver either belongs to one or more different communities or does not belong to any community at all. • CG: Union of CC and CG minus CC. • GC minus CC: Edges where the receiver of the communication belongs to a given community, and the originator either belongs to one or more different communities or does not belong to any community at all. • GC: Union of CC and GC minus CC. • GG minus any C: Edges where neither the originator nor the receiver of the communication for any given edge belongs to any community. • HD40: Edges where either the originator or the receiver of the communication for any given edge has a minimum degree of 40.