Download
1 / 51
510 likes | 596 Views
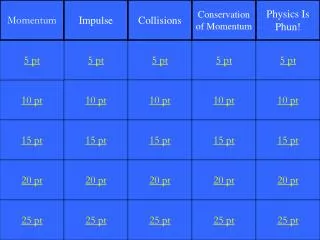
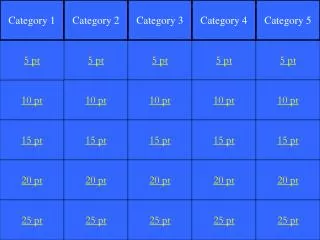
Definitions. Calculations. What’s That?. I would use…. Grab Bag. 5 pt. 5 pt. 5 pt. 5 pt. 5 pt. 10 pt. 10 pt. 10 pt. 10 pt. 10 pt. 15 pt. 15 pt. 15 pt. 15 pt. 15 pt. 20 pt. 20 pt. 20 pt. 20 pt. 20 pt. 25 pt. 25 pt. 25 pt. 25 pt. 25 pt.

E N D
Definitions Calculations What’s That? I would use… Grab Bag 5 pt 5 pt 5 pt 5 pt 5 pt 10 pt 10 pt 10 pt 10 pt 10 pt 15 pt 15 pt 15 pt 15 pt 15 pt 20 pt 20 pt 20 pt 20 pt 20 pt 25 pt 25 pt 25 pt 25 pt 25 pt
This is the difference between the largest number and smallest number in a data set.
You must calculate the five number summary to construct this.
These are the ways that a histogram differs from a bar graph.
What are “no spaces between the bars in a histogram” and “the y-axis is always the frequency”?
What are the minimum, lower quartile, median, upper quartile, and the maximum?
These are more than 1.5 times the IQR less than the lower quartile or more than 1.5 times the IQR more than the upper quartile.
This is the mean of 92, 98, 15, 92, 87, and 92 rounded to the nearest whole number.
This is the interquartile range of 378, 410, 370, 336, 361, 394, 345, 328, 388, and 339.
This is the median of the following stem-and-leaf plot: 1| 227 2| 33344566889 3| 0146 4| 06
This is the UQ of the following stem-and-leaf plot: 5| 5899 6| 0012233456788 7| 012
This describes the center of a set of data, and it takes into account the value of each data point.
This lists one place value on one side of a vertical bar, and the other in numerical order on the other side. It usually also gives a key.
This is a chart that uses tally marks and categories to organize data.
This is the name for the categories used in a frequency table.
This is the name for the line drawn from the UQ to the maximum in a box-and-whisker plot.
I would use this to describe the typical number of cars owned by a person in Lexington.
I would use this tool to categorize the grams of sugar per serving in 31 different cereals.
This would be used to quickly give a picture of cost per ounce of several brands of potato chips.
You would use this as a scale for a line plot and a box-and-whisker plot.
This would be a good way to compare the number of home runs hit by the National league to the number hit by the American league in professional baseball over the last 70 years.
This is the number that appears most frequently in a data set.
Anna’s test scores are 98, 90, 93, 99, and 10 on the five tests she took this semester in social studies. This is the measure of central tendency which best describes her work.
This is the median of the following data set: 70 74 12 34 23 78 45 32 55 51 89 43 32 11 25 62 43 78 70 72
This is approximately the part of the data in the box of a box-and-whisker plot.