Download
1 / 3
30 likes | 192 Views
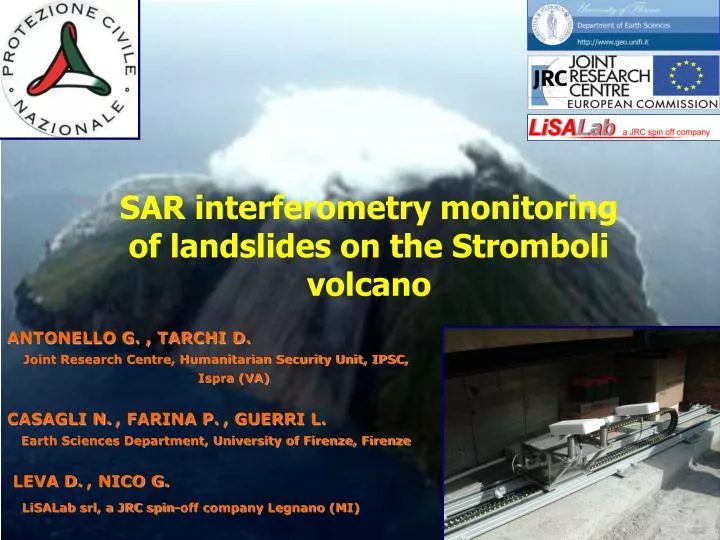
SAR interferometry monitoring of landslides on the Stromboli volcano. ANTONELLO G. , TARCHI D. Joint Research Centre, Humanitarian Security Unit, IPSC, Ispra (VA) CASAGLI N. , FARINA P. , GUERRI L. Earth Sciences Department, University of Firenze, Firenze LEVA D. , NICO G.

E N D
SAR interferometry monitoring of landslides on the Stromboli volcano ANTONELLO G. , TARCHI D. Joint Research Centre, Humanitarian Security Unit, IPSC, Ispra (VA) CASAGLI N., FARINA P., GUERRI L. Earth Sciences Department, University of Firenze, Firenze LEVA D., NICO G. LiSALab srl, a JRC spin-off company Legnano (MI)
Subject Interferogram represents a period of 12h from 01.10AM to 01.10PM (GMT+14) of 13-04. This image shows the displacements of the Sciara and of the flank of crater Interferogram relative a period of 1h from 07.36AM to 08.36AM (GMT+14) of 01-03 that show the movement slow for the lava flow Interferogram relative a period of 6h 39’ from 04.57AM of 15-07 to 03.36AM (GMT+1) of 17-07. The image shows sectors con differents movements Pictures of the unstable area Interferograms represent a period of 24h 10’ from 08.04 (GMT+1) of 10.11 to 09,51 (GMT+1) del 11-11 Interferograms represent a period of 5h 42’ from 05.02 to 10,44 (GMT+1) of 15-08. this shows the impulsive movement spanning at massimo 24h
Results Velocity in the 4 selected points plotted versus time at steps of 6 hrs and 4 points moving averages Interpreted average velocity of the landslide plotted versus time at steps of 24 hrs and Fukuzono’ s analysis